 |
|
|
||||||||||||||||
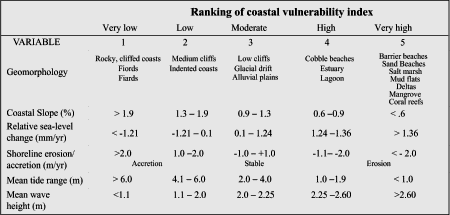
Table 1. Ranking of coastal vulnerability index variables for the U.S. Pacific Coast. | |
Once each section of coastline is assigned a risk value for each specific data variable, the coastal vulnerability index (C.V.I.) is calculated as the square root of the geometric mean of these values, or the square root of the product of the ranked variables divided by the total number of variables as
where,
- a = geomorphology
- b = coastal slope
- c = relative sea-level rise rate
- d = shoreline erosion/accretion rate
- e = mean tide range
- f = mean wave height
The C.V.I. values reported here apply specifically to the U.S. Pacific coast. Thus, absolute C.V.I. values given for other coasts (e.g., Thieler and Hammar-Klose, 1999) are not directly comparable to the data presented here. In addition to the C.V.I. values, the data ranges are also subdivided using values different from other studies so that the values used here reflect only the relative vulnerability along this coast. We feel this approach best describes and highlights the vulnerability for each of the different continental margin types that make up the U.S. coast.
| Previous Page | Contents | Back to Top | Title Page |
|
Next Page |
| Introduction | Risk Variables |
Data Ranking |
C.V.I. | Results | Discussion | Summary | References |
| [an error occurred while processing this directive] |
