National Assessment of Coastal Vulnerability to Sea-Level Rise: Preliminary Results for the U.S. Pacific Coast
Data Ranking
Click on chart for larger image
 |
|
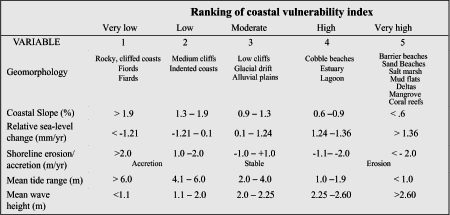
Table 1. Ranking of coastal vulnerability index variables for the U.S. Pacific Coast. |
Table 1 shows the six physical variables as described in Risk Variables, ranked on a linear scale from 1-5 in order of increasing vulnerability due to sea-level rise. In other words, a value of 1 represents the lowest risk and 5 represents the highest risk. The database includes both quantitative and qualitative information. Thus, numerical variables are assigned a risk ranking based on data value ranges, whereas the non-numerical geomorphology variable is ranked according to the relative resistance of a given landform to erosion. For the U.S. Pacific coast, regional coastal slopes are considered to be very low risk at values >1.9 percent; very high risk consists of regional slopes <0.6 percent. These ranges are chosen based on the maximum, minimum and statistical variation of the slope values along the Pacific coast. The rate of relative sea-level rise is ranked to reflect the regional to local isostatic or tectonic effects along the Pacific coast, taking into account that these data also reflect the modern rate of eustatic rise (1.8 mm/yr; Douglas, 1997; Peltier and Jiang, 1997). Shorelines with erosion/accretion rates between -1.0 and +1.0 m/yr are ranked as moderate. Increasingly higher erosion or accretion rates are ranked as correspondingly higher or lower risk. Tidal range is ranked such that microtidal coasts are high risk and macrotidal coasts are low risk. Mean wave height rankings range from very low (<1.1 m) to very high >2.6 m).
In previous and related studies (Gornitz, 1990; Shaw et al., 1998), large tidal range (macrotidal; tide range >4m) coastlines were assigned a high risk value, and microtidal coasts (tide range <2.0 m) received a low risk value. This decision was based on the concept that a large tide range is associated with strong tidal currents that influence coastal behavior. We have chosen to invert this ranking such that a macrotidal coastline is classified as low risk. Our reasoning is based primarily on the potential influence of storms on coastal evolution, and their impact relative to the tidal range. For example, on a tidal coastline, there is only a 50 percent chance of a storm occurring above mean tide. Thus, for a region with a 4 m tide range, a storm having a 3 m surge height is still up to 1 m below the elevation of normal high tide for half a tidal cycle. A microtidal coastline, on the other hand, is essentially always "near" high tide and therefore always at the greatest risk of significant storm impact.
|