National Assessment of Coastal Vulnerability to Sea-Level Rise: Preliminary Results for the U.S. Pacific Coast
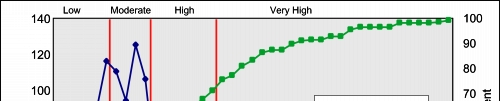
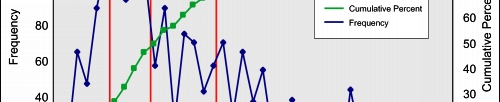
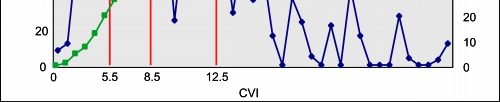
Figure 2. Histograms showing the frequency of occurrence and cumulative frequency of C.V.I. values for the U.S. Pacific coast. The vertical red lines delineate the chosen ranges for low, moderate, high, and very high risk areas.
|