National Assessment of Coastal Vulnerability to Sea-Level Rise: Preliminary Results for the U.S. Pacific Coast
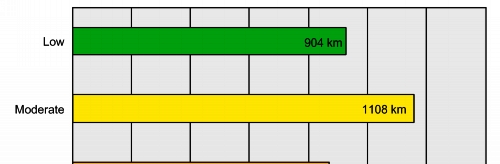
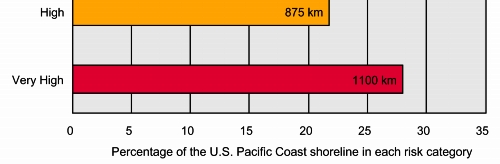
Figure 3. Bar graph showing the percentage of shoreline along the U.S. Pacific coast in each risk category. The graph also shows the total length of shoreline (in kilometers) in each risk category. The total length of mapped shoreline in this study is 3987 km.
|