
Digital Mapping Techniques '00 -- Workshop Proceedings
U.S. Geological Survey Open-File Report 00-325
Three-Dimensional Geologic Mapping of the
Villa Grove Quadrangle, Douglas County, Illinois
By Curtis C. Abert, C. Pius Weibel, and Richard C. Berg
Illinois State Geological Survey
615 East Peabody Drive
Champaign, IL 61820
Telephone: (217) 244-2188
Fax: (217) 333-2830
e-mail: abert@isgs.uiuc.edu
ABSTRACT
Geologic formations have variable lateral extents, thicknesses, and/or depths below the land surface. The three-dimensional (3-D) nature of geologic formations has been difficult to portray on traditional 2-D geologic maps. Advances in computing technology and software have made it possible to model the 3-D nature of geologic materials and subsequently, to portray this information on 2-D printed maps. The real power of modeling 3-D geology lies within the digital environment. However, digital simulations of 3-D geology do not come without cost. High-end computers and software are perhaps the most tangible costs. Intangible costs include personnel, data collection and quality assurance/quality control (QA/QC). This paper will present some of the difficulties associated with constructing a detailed 3-D model, as well as highlight the benefits and uses of detailed 3-D geologic modeling of the Villa Grove 7.5-minute quadrangle in Douglas County, Illinois.
INTRODUCTION
Purpose of the Mapping
The Illinois State Geological Survey (ISGS) has a long history of using Geographic Information Systems (GIS) for geologic mapping and database development (Krumm et al., 1997). Recent projects at the ISGS have focused on detailed 1:24,000-scale mapping of 7.5-minute quadrangles. The primary objective of the mapping project is to thoroughly map the geology of a quadrangle in three dimensions (3-D) and provide a comprehensive suite of maps to serve the needs of regional and local planners and other governmental officials, business and industry, and private citizens. The Villa Grove Quadrangle was chosen as a pilot project to develop and test large-scale 3-D mapping methods for producing a 3-D map atlas. Included in the atlas are basic geologic maps of surficial geology, drift thickness, bedrock topography, and bedrock geology, as well as derivative maps of aquifer resources, aquifer sensitivity, coal resources, aggregate resources, and others. A derivative map is an interpretation of geologic data for specific environmental or resource purposes. The basic geologic maps were both derived from, and provided data for, the 3-D geologic model.
Regional Geologic Setting
Low-relief unlithified materials deposited during the Quaternary Period overlie Paleozoic bedrock within the Villa Grove Quadrangle. The unlithified Quaternary materials are predominantly glacial diamictons (tills) related to three glacial episodes, but also include glaciofluvial (sand and gravel) and glaciolacustrine (silt and clay) materials as well as materials deposited and formed during interglacial episodes (loess and soils) and the present post-glacial episode (Hansel et al., 1999). Elevations of the land surface range from greater than 216 meters (708 feet) to less than 187.5 meters (615 feet) for approximately 28.5 meters (93 feet) of relief.
The Villa Grove Quadrangle is situated on the eastern limb of the asymmetrical doubly plunging Tuscola Anticline. Dips of bedrock units are generally less than 1 degree to the east or east-northeast (Weibel and Lasemi, 2000). The topography of the bedrock surface is one of the more significant mapped surfaces, because it defines the bottom of the Quaternary units and the top of the Paleozoic units. Elevations of the bedrock surface range from greater than 600 feet to less than 425 feet (175 feet of relief) (Weibel, 1999). The prominent valleys and uplands of the bedrock surface were most likely formed by a pre-glacial drainage network that was subsequently modified during early glaciations (Melhorn and Kempton, 1991 and Soller et al., 1999). Many bedrock valleys in Illinois are partially filled with sand and gravel, which can be important regional and local aquifers.
CONSTRUCTING THE 3-D
GEOLOGIC MODEL
Input Data
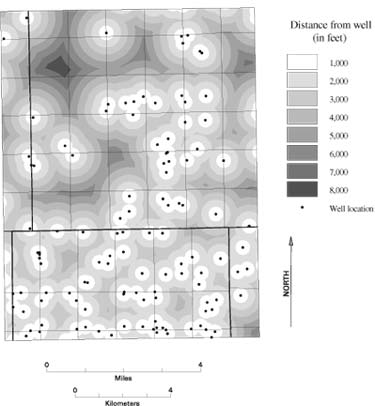
Figure 1. Locations and distances between points within the Villa Grove Quadrangle.
|
The Villa Grove 3-D geologic model was constructed primarily from data extracted from logs of water wells, geologic test borings, engineering borings, and mineral test borings. Additional data included surface elevation data (digital elevation model), geologic map data, soil test borings, soil data, and isopachous (thickness) maps from previous studies. Data extracted from the logs of wells and borings include formation description, lithology, depth, and thickness. Data quality ranged from very good for the geologic test borings to uncertain or poor for some water well data, and the spacing and density of wells varied significantly over the quadrangle. For modeling the Quaternary deposits, a total of 181 data points were used. The data points were generally within 2,000 to 3,000 feet of one another, but some were more than 7,000 feet from the nearest other data points (figure 1). Data density ranged from 24 points to zero points per Public Land Survey section. Coordinates, elevations, and properties of data points were assembled into ASCII files and imported into EarthVision, a geologic modeling software.
Modeling Hardware and Software
The ISGS used a combination of GIS (ArcInfo, ESRI) and 2-D and 3-D modeling software (EarthVision, Dynamic Graphics Inc.) to construct the 3-D geologic model. Oracle (Oracle Corp.) was used to manage the water well and boring database. The primary platforms used for analysis and display of data and models were Sun (Sun Microsystems, Inc.) Ultras with Creator3D graphics cards, and Silicon Graphics (Silicon Graphics, Inc.) workstations.
Basic Modeling Assumptions
A traditional 2-D geologic map is necessarily an abstraction of reality. The true complexity and detail found on or within the Earth cannot be portrayed on such a map. A 3-D computer model is another abstraction of reality. Features that can be portrayed on a traditional geologic map must be further generalized to produce a computerized model due to limitations in computer hardware and software. The replication of a traditional 2-D geologic map in a 3-D geologic model is difficult. Variables such as map scale, screen resolution, amount of input data, model dimensions, and cell size will affect the resulting 3-D model. However, 3-D geologic models can be used in the construction of traditional 2-D geologic maps.
EarthVision uses a 3-D grid to store, interpolate, and build geologic models and the geologist must give thought to determining the appropriate cell sizes in the X, Y, and Z dimensions. For the Villa Grove model, an X/Y cell size of 1,320 feet (1/4 mile) and a Z cell depth of 20 feet were chosen to model all materials to a depth of 1400 feet below mean sea level. A more detailed model of just the unlithified Quaternary deposits had a Z cell depth of 10 feet. The cell spacing was determined by considering the accuracy of data point locations and their density, as well as software and hardware limitations. Models produced with a grid that is too coarse may oversimplify the geology, but models with finer grids produce much larger files and take more computing resources to calculate. Also, extrapolation artifacts may be introduced in the model if there are many grid cells interpolated between distant data points.
Another consideration in building 3-D geologic models is the extent of the input data. Where data are sparse, especially near the edges of the map area, modeled surfaces may be unreasonably extrapolated. Therefore, it is advantageous to model an area that extends beyond the actual area of interest. The added data points located in the "buffer" area provide much-needed edge control of extrapolation in the model. Excessive extrapolation near the edges of the buffer area can be removed from subsequent displays, leaving only a reasonable model for the main study area. In constructing the Villa Grove 3-D model, we used a buffer area of up to 3 miles.
Types of Geologic Models
Two basic types of models were created during the project -- stratigraphic models that show the 3-D geometry of geologic units, and lithologic models that show variations of the texture of materials within geologic units. The stratigraphic models were created by first modeling stratigraphic horizons as 2-D grids. Generally, shallow units have more control than deeper units. However, this was not the case within the Quaternary deposits compared to the uppermost bedrock units. The horizons between the Wisconsin/Illinois, and Illinois/pre-Illinois glacial episodes were defined by 36 and 22 points, respectively, but the topography of the bedrock surface was defined by a total of 170 points (91 in the quadrangle). The surface of the deepest modeled bedrock unit, however, was defined by a total of 33 points (only 4 of which were actually within the quadrangle). Additional control could be achieved on the deeper bedrock surfaces by using better-defined upper surfaces as intermediate or "helper" surfaces. Where data were sparse on deeper surfaces, the surface was modeled to somewhat parallel upper surfaces. This technique is appropriate only for conformable geologic units with fairly consistent thickness. In Illinois, bedrock units are likely to have fairly consistent thicknesses over a 7.5-minute quadrangle size mapping area. Figure 2 shows the stratigraphic model for the bedrock units in Villa Grove Quadrangle.
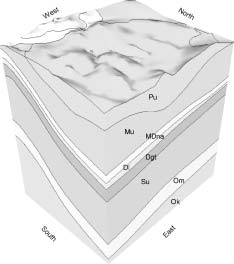
Figure 2. Three-dimensional stratigraphic model of the bedrock in the Villa Grove Quadrangle. Vertical exaggeration 25X.
|
|
|
|
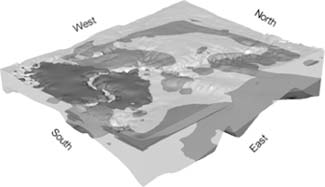
Figure 3. Semi-transparent view of the three-dimensional property model of Quaternary deposits in the Villa Grove Quadrangle, showing lithologic variations. Coarse-grained material exposed at the land surface or "exposed" on the model sides are shown in dark gray. Coarse-grained material in the subsurface are shown in medium gray. Fine-grained material is shown in light gray. Vertical exaggeration 40X.
|
Generalized lithologic models were prepared for the Quaternary materials, consisting of the thickness and extent of sands and gravel layers (potential aquifers) and diamictons (aquitards). Lithologic descriptions from the well and boring database were classified as either coarse-grained or fine-grained, and numeric codes (1 for fine grained, 3 for coarse-grained) assigned to the units. The numeric lithologic codes, along with coordinates and elevations of the units, were loaded into EarthVision to create a 3-D property model. EarthVision can create 3-D contours or "shells" of property values in 3-D space. In our models, the contour shells ranged in value from 1 (fine-grained) to 3 (coarse-grained). The contour shell with the value of 2 was determined to be the "contact" between the fine and coarse-grained lithologies. Variables within the gridding algorithm were used to constrain extrapolation. Further control on extrapolation was gained from limiting the interpolation of 3-D contours to specific geologic units. Figure 3 shows the generalized lithologic model of Quaternary deposits within the Villa Grove Quadrangle.
CONCLUSIONS
Computerized modeling of the 3-D nature of geology can lead to a much greater understanding of the relationships of units, but the geologist's participation in the iterative process of modeling provides essential feedback to the model that ensures that the final result is a geologically reasonable interpretation of the available data. While it may not be appropriate in all geologic settings, development of 3-D lithologic property models have proven to be a useful tool in mapping Illinois' geology. Stratigraphic models can be used for nearly any geologic setting. Several advantages and disadvantages of the 3-D geologic modeling include the following.
Advantages
- Many modeling systems do not allow preference to be given to "better" data -- all data are treated equally. This can allow for an unbiased or holistic view of the 3-D relationships of the data.
- Computerized 3-D modeling allows for updates or modifications of the model to be made when additional data are available or changes in modeling parameters are tested.
- Many different kinds of data can be combined and used to produce a 3-D model.
- Data can be extracted from 3-D models to produce other products (for example, a stack-unit map can be produced)
- 3-D views of geology are more easily understood than traditional geologic maps by the general public.
Disadvantages
- Many modeling systems do not allow preference to be given to "better" data -- all data are treated equally. Geologists generally have more confidence in certain data than in others, and would like to give more weight to better data.
- Computerized 3-D modeling allows for repeated updates or modifications of the model with additional data or changes in modeling parameters. The update process may require significant effort. It is a common misconception that "because it is digital, it must be easy to do or require minimal effort."
The best geologic models integrate the geologist's logic and knowledge with the impartiality of the 3-D modeling software. The ability of the computer to manipulate large amounts of data is best used when it is paired with a geologist's ability to determine what is "real."
REFERENCES
Hansel, A.K., Berg, R.C., and Abert ,C.C., 1999, Surficial Geology Map, Villa Grove Quadrangle, Douglas County, Illinois: Illinois State Geological Survey Illinois Geologic Quadrangle Map IGQ Villa Grove-SG, map scale 1:24,000.
Melhorn, W.N., and Kempton, J.P., 1991, The Teays System: A Summary, in Melhorn W.N. and J.P. Kempton, eds., Geology and Hydrogeology of the Teays - Mahomet Bedrock valley System: Geological Society America Special Paper 258, p. 125-128.
Krumm, R.J., Abert, C.C., Nelson, D.O., and Hester, J.C., 1997, Review of Digital Mapping Techniques: The Illinois Experience, in D.R. Soller, ed., Digital Mapping Techniques '97 -- Workshop Proceedings: United States Geological Survey Open-File Report 97-269, p. 5-8, http://ncgmp.usgs.gov/pubs/of97-269/krumm.html.
Soller, D.R., Price, S.D., Kempton, J.P., and Berg, R.C., 1999, Three-dimensional Geologic Maps of Quaternary Sediments in East-central Illinois: U.S. Geological Survey Geologic Investigations Series Map I-2669, three sheets, https://pubs.usgs.gov/i-maps/i-2669/.
Weibel, C.P., and Lasemi, Zakaria, 2000, Geological Map of the Bedrock Surface, Villa Grove Quadrangle, Douglas County, Illinois: Illinois State Geological Survey Illinois Geologic Quadrangle Map IGQ Villa Grove-BG, map scale 1:24,000.
Weibel, C.P., 1999, Topographic Map of the Bedrock Surface, Villa Grove Quadrangle, Douglas County, Illinois: Illinois State Geological Survey Illinois Geologic Quadrangle Map IGQ Villa Grove-BT, map scale 1:24,000.
U.S.Department of the Interior, U.S. Geological Survey
<https://pubs.usgs.gov/openfile/of00-325/abert.html>
Maintained by Dave Soller
Last updated 11.01.00