
Digital Mapping Techniques '00 -- Workshop Proceedings
U.S. Geological Survey Open-File Report 00-325
Geological Map Production for Dummies
By Vic Dohar and Dave Everett
Natural Resources Canada
601 Booth Street
Ottawa, Ontario K1A 0E8
Telephone: (613) 943-2693, 996-9353
Fax: (613) 952-7308
e-mail: vdohar@nrcan.gc.ca, devertt@nrcan.gc.ca
INTRODUCTION
The Cartographic Services Section of the Earth Sciences Info Division, Natural Resources Canada produces maps for the geologists of the Geological Survey of Canada (GSC). The section consists of 30 employees, 20 being cartographers, along with cartographers in regional GSC offices across the country. Approximately 60-80 geological maps are published per year, with the majority being plotted by an on-demand system. A variety of products are produced, including A-series, open files and various posters for the general public and educational clients.
In late 1999, the section became ISO 9001 registered (International Standards Organization), committing the section to producing quality products and providing quality services that satisfy or exceed client requirements. This has involved developing a production and management system resulting in high quality and timely delivery of cartographic products. The system itself is comprised of procedures, production guidelines, forms and instruction manuals. Scheduled audits of the section are required in order to maintain ISO 9001 registration status.
History of Digital Production
The section began experimenting with ESRI's ArcInfo software in the late 1980's, using version 5.0 on a VAX/VMS platform/operating system. By 1992, our first digital map was produced and by 1994, after training of staff of the new digital technology, all geological maps were being produced using ArcInfo 6.0 on Sun UNIX workstations. In 1995, the section's on-demand system was established to quickly publish open files. More recently, the use of ArcInfo software has been shifting from a UNIX to a Windows NT operating environment.
PRODUCTION STEPS
The cartographic production steps are generally divided into the following six steps:
- Acquisition and Input
Digital data is usually obtained from the geologist as a DXF or E00 file from Fieldlog, AutoCAD, or MiniCAD. Point data can also be accepted as an ASCII file. Original mylar or paper manuscripts are scanned and vectorized using ArcInfo.
- Verification
Things we always ask ourselves and the geologist before starting any edits...
- Is the data in the correct projection and datum as stated by the geologist?
- Is the data accurately geo-referenced?
- Is the latest available digital base used?
- Is the data properly feature coded?
- Is all supporting documentation supplied by the geologist?
- Editing and Attributing
Main tasks involve ensuring features are topologically correct, attributed and symbolized according to Cartographic Digital Standards (CDS). Original manuscripts that were scanned require geo-referencing, and interactive editing and feature coding. All text or annotation on the map is added interactively.
- Preparing the Map Layout
Most surround information is plotted as separate custom ArcInfo plotting commands relying on meta data information (e.g., commands would be TITLEBLOCK, CITATION, and GSCLOGO). Geological legends are created using a simple text or ASCII file, and descriptive notes, references and figures are included as EPS files.
- Quality Control
A filtering process is used to create a report document that checks the project for completeness and correct feature attribution. Quality control officers ensure that the map meets design specifications and that the digital data conforms to CDS. All maps are reviewed by the geologist prior to publication and A-series maps are further reviewed by scientific editors.
- Plotting/Printing and Archiving
A final PostScript file is created for both the on-demand plotting system and for offset printing. The project is archived onto two CD-ROM's, including E00 and shape files of all coverages used in the production of the map.
GEOLOGICAL MAPPING SYSTEM (GEMS)
GEMS is simply a graphical user interface and a set of custom ArcInfo plotting commands used to aid cartographers in the production of geological maps. Many repetitive and routine tasks are compiled into programs. It is written entirely in AML (Arc Macro Language), consisting of approximately 800 files. GEMS also includes the standard GSC symbolsets for lines, markers (points), shades (area), and text. Currently, it is compatible with ArcInfo 7.2.1, and testing with ArcInfo 8.0.1 (workstation version) is under way. GEMS can be downloaded free from our web site, http://nrcan.gc.ca/ess/carto/english/reference/gems/gems.html, as a 24Mb tar file. Listed below are a few of the GEMS tools that cartographers use every day.
Map Border
A map border can be created simply by specifying the publication scale, latitude and longitude extremes, name of coverage to create, and projection definition (figure 1).
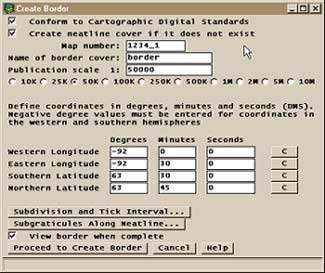
Figure 1. Menu for entering map border specifications.
|
Editing Annotation
GEMS simplifies the adding and editing of annotation in ArcInfo, by an easy to use menu. Users simply have to specify the publication scale, the size of annotation in points not coverage units, the text symbol from the textset, the text string and whether the annotation is placed along an existing arc, at 90 degrees or by entering coordinates with the mouse. Options also exist to automatically adjust angle of annotation to be square with page when specifying a map angle (figure 2).
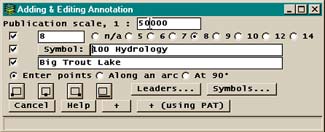
Figure 2. Menu for adding and editing annotation.
|
Map Surround
Surround information on the map, such as logos, location map, titleblock, and recommended citation, are all plotted using custom plotting commands (AML programs) that uses meta data information (figure 3). The custom LEGEND command is used to plot a geological legend by using a simple text or ASCII file. The text file obtained from the geologist is edited and embedded with special legend plotting commands and codes (shown in bold in sample text file below). These commands and codes, in turn, plot boxes, lines, symbology, and text that are common to all geological legends (figure 4).
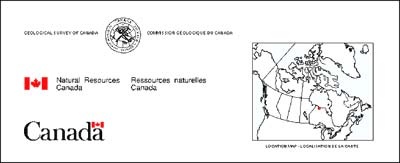
Figure 3. Sample map surround elements.
|

Figure 4. Geological legend created from sample text file at right.
|
/* Change default settings
SET box_font GSCSpecial-Regular
AP �SHADEDELETE ALL; SHADESET GSC'
COLUMN 3.0 0.5
BRACKET TOP
HEADING L QUATERNARY
BOX 7 /Mr
DESC
Glacial deposits; gravel and sand
BRACKET BOTTOM CENOZOIC DOWN
BRACKET TOP
TEXT 'INTERMEDIATE STRUCTURAL SLICES' DASH
BOX 9 |Mr
DESC
Interlayered rhyolilte, mafic tuff and flows, slate
BOX 25
AP 'SHADEDELETE ALL; SHADESET GSC_PTRN'
PATTERNFILL 120 # # ON |Mg
AP 'SHADEDELETE ALL; SHADESET GSC'
DESC
Black and green mudstone, greywacke
BOX 116 |Ka # 1
DESC
FRASER BROOK FORMATION: !FNT110001; |Ka!FNT110003;, rhyolite,
minor andesite, basalt, red siltstone, slate; !FNT110001; | Kb!FNT110003;,
andesite, minor rhyolite, basalt, red siltstone; !FNT110001; | Kc!FNT110003;,
basalt,minor andesite, rhyolite, slate, minor volcanics
BOXSIZE 4.5 10
SUBBOX 9 0 117 b
SUBBOX 13.5 0 119 c
BRACKET BOTTOM PROTEROZOIC UP
END
|
Custom GSC Symbolsets and Geological Font
All of the GSC symbolsets are created in ArcInfo using IGL fonts. The symbolsets are continuously being updated as new symbols are added based on requests from the geologists. Symbol numbers in the GSC colour shadeset correspond to percentages of cyan, magenta and yellow (e.g., symbol 264 is 20% cyan, 60% magenta and 40% yellow). GSC symbolsets are included with GEMS or are available separately at the web site.
The special geological font consists of age characters and is required in order to meet our design specifications. These special characters are mapped to non-alpha characters on the keyboard, which still allows the use of alpha characters. In addition, uppercase alpha characters are scaled 80% as per design specifications (figure 5).

Figure 5. Geological age font showing keyboard mapping.
CARTOGRAPHIC DIGITAL STANDARDS (CDS)
The Cartographic Digital Standards explains the general procedures for each production phase of a geological map. It lists the required coverages and files for each map project/workspace, along with the naming convention, definitions and content of feature attribute tables. The features are managed by dividing them into the following three categories: base, geology and other.
Base Features consists primarily of hydrology features, comprised of arcs and polygons, where the polygons are used as a water mask when making final plots. In other words, water bodies are plotted as solid white, masking the geology plotted beneath. Remaining base features are divided into two coverages, one for lines and points, and the other for polygons.
Geology features are divided into four coverages: geological units and contacts consisting of arcs and polygons, linear features, point features, and overlapping polygons, consisting of arcs and polygons.
Other features completing the geological map consists of the map border and neatline, all annotations or text on the map, miscellaneous features for the purpose of hardcopy output, and the NTS (National Topographic System) Reference Map.
Symbolizing and Coding Features
In order to symbolize features for hardcopy output, each feature attribute table contains an integer item, where its value corresponds to a symbol from the symbolset file. In addition, each feature attribute table contains an item CODE, where its value relates to a legend INFO file or lookup table. The legend info file contains the description of the feature as it appears in the legend on the hardcopy map.
In addition, geology features have links for relates to other external tables or INFO files as supplied by the geologist. Point features have a few additional items to record common information such as strike and dip values.
OUTPUT
Map output primarily takes the form of a hardcopy map, published either by on-demand plotting or offset printing. Digital release of data is available upon permission from the geologist's division director, and is distributed on CD-ROM. Displaying geological maps on the internet in an interactive format is in the preliminary stages of development.
On-Demand Plotting Service
The on-demand plotting system was initiated in 1995 using high-speed single-pass Synergy electrostatic plotters (no longer available). These plotters were able to produce an average size map in about one minute, much faster than today's inkjet technology, however image and paper quality were poor. In an effort to produce high quality press-like maps using an on-demand system, HP ink jet plotters and a ZEH graphics RIP (raster image processing) were implemented in late 1999.
The system is used for plot file submissions by geologists, cartographers, and map sales at the GSC Book Store. A web-based interface is accessible by users with account privileges for submitting plot files and monitoring the plotting queues. Currently, there are four plotters available (36" and 54") for plotting, producing approximately 6000 plots per year. In addition, the ZEH graphics RIP system has been modified to include a method to record plotting usage for cost recovery purposes.
Offset Printing
A-series maps are printed using offset printing where large sales and distributions are forecasted (approximately 500 or more sheets). PostScript files created from ArcInfo are used to create negatives from which a pre-press proof and printing plates are created. Printing and negative artwork generation is performed within the department, as these facilities are used in conjunction with other government mapping agencies.
U.S.Department of the Interior, U.S. Geological Survey
<https://pubs.usgs.gov/openfile/of00-325/dohar.html>
Maintained by Dave Soller
Last updated 11.09.00