Louisiana Geological Survey
Louisiana State University
208 Howe-Russell Geoscience Complex
Baton Rouge, Louisiana 70803-4101
Telephone: (225) 388-5320
Fax: (225) 388-3662
e-mail: Hampton@lsu.edu, mccullo@lsu.edu
The images of the scanned lines were digitized using the Directional Trace Line String function of INTERGRAPH's GEOVEC software. Each quadrangle of digitized linework was georeferenced using the Control Point Setup function of INTERGRAPH's MGE software. A graticule was generated using the Grid Generation function of the MGE software. The linework and the graticule were merged into a mosaic; and edgematching was performed, all using MGE. The graticule was the source of the digital, 7.5-minute quadrangle boundaries. After completing the line cleaning, the digital geologic quadrangles were translated into ArcInfo coverages for topology building. These topologically correct polygon coverages were then translated into ArcView shapefiles. Finally, the database for each shapefile was populated with attributes using ESRI's ArcView software.
Figure 1. Location map of 10 quadrangles composing Fort Polk study area. |
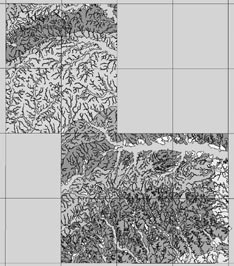
Figure 2. Surface geology mosaic of Fort Polk study area. The comparatively narrow and complexly branching polygons are the (Holocene, undifferentiated) alluvium. |
Figure 2 shows a mosaic of the surface geology mapped for the 10 quadrangles in the study area. We also compiled economic geology, as a derivative of surface geology and from field notes, using a mixed representation of polygons and points; and geologic hazards, found to comprise only flooding, which was recompiled as polygons from Federal Emergency Management Agency (FEMA) flood maps. Because both of these layers are themes ultimately derived from aspects of the surface geology, the latter was the main focus of our efforts. This was our first 7.5-minute geologic GIS compilation in which we compiled both the geologic data and the GIS. Although we had a keen interest in developing a standard methodology for future projects, we were constantly on the learning curve in this first such collaboration. The data were compiled as individual quadrangles at 1:24,000, but the GIS was designed such that the corners and boundaries of adjacent quadrangles coincide seamlessly without breaks, regardless of the scale of viewing the data. (This design feature is discussed in greater detail below.)
In our field work we encountered problems of accessibility. First, exposures of the geologic map units of interest to us are scarce. In most places they are covered by thick soil, vegetation, and surficial deposits; and most of the surficial deposits in the study area are not diagnostic of the underlying map units. Most exposures are associated with roads and streams; those associated with roads are more accessible and for our purposes were more abundant, but a majority of them comprise small and highly inconspicuous stretches along the lower reaches of road ditches, and lack discernible macroscopic or mesoscopic depositional structure. Another access problem derived from restrictions characteristic of military property: timing of our access to various portions of the study area had to be scheduled to accommodate training rotations, and some parts of it, such as impact areas, are permanently off-limits. Finally, much of the study area not on military property is controlled by timber companies and hunting clubs, and is not easily accessible.
A majority of the pre-Plio-Pleistocene section comprises Miocene strata that consist of continental/fluvial facies, near the transition to a deltaic regime. This accounts for the alternation of sand- and silt-rich lithofacies, which contain some gravel, with finer-grained units interpreted as brackish-water facies--which is the basis for subdivision of the Miocene into mappable units of formation rank (though they are traditionally referred to as members of the Fleming Formation). The finer-grained units are the thicker tongues that actually extend all the way updip to the outcrop. Some of the Oligocene and lower Miocene section contains beds of silicified rock, including some that are quarried locally, but most of the sediment in the study area is poorly consolidated to semiconsolidated. The most significant unconformity is that between Plio-Pleistocene and Miocene strata, which is marked in places by indicators that may include either or both of the following: a distinctive purplish alteration color in fine-grained Miocene sediment immediately beneath the unconformity; and rip-up clasts of the purplish mud in the overlying Plio-Pleistocene.
Figure 3. Copy of field quad with notes, 1:24,000-scale Simpson South quadrangle.
While the field work was underway, we simultaneously interpreted alluvium directly from the topographic base maps, for two principal reasons. First, this is in fact the most consistent and systematic way to interpret the alluvium, which is resolved as a continuous network of low-relief bottomland landforms. And second, alluvial deposits tend to be overgrown with vegetation, so effective field access to alluvium is even more of a problem than with the other geologic map units. We began this alluvial mapping early in the project because, as is clear from figures 2 and 4, alluvium constitutes a very large proportion of the total linework. We traced this linework on vellum, which was a continuation of our methodology from previous non-GIS projects, and we completed this component long before the field mapping of the other units was brought to a close. Polygons of the nonalluvial (suballuvial) geologic units were ultimately created by contour-mapping in detail the areas that had been distinguished initially with color highlighting on the full-size quadrangle photocopies. We traced this linework, plus faults, in different colors on mylar.
This was the point at which the GIS compilation picked up the process from what had been essentially field-mapping procedures before. Mylar and vellum overlays were formatted with corner ticks and 2.5-minute reference crosses in black ink. Both were also formatted with approximated quadrangle boundaries or graticule lines, which for the mylar overlays was done using blue ink. After the hardcopy overlays with these two different types of linework were manually edgematched and labeled, scans of them were used as source data in the digitizing process, and the two were ultimately combined in the GIS. The composite linework was edited to show the alluvium occluding the other surface-geologic units, as it does in reality. The following section discusses in detail the specific aspects of the GIS compilation.
Figure 4. Scan of alluvial linework, Simpson South quadrangle. The comparatively narrow and complexly branching polygons are the (Holocene, undifferentiated) alluvium. Also mapped on the same overlay are low terraces--the adjacent smaller, more equidimensional polygons. |
The digitizing effort was performed with the automated line following function of INTERGRAPH'S GEOVEC software. GEOVEC runs on top of Bentley's MicroStation and INTERGRAPH'S Base Imager; and it employs the MicroStation Feature Collection System. The initial digitizing effort consisted of three phases:
With the intersections broken, for each control corner or cross, we could then georeference the alluvium by snapping to the intersection. All of the georeferencing was performed within the MGE environment, using the Control Point Setup function. All eight control points, at 2.5-minute intervals, were used for each quad as we georeferenced them in the Louisiana "State Plane" Coordinate System, North Zone, as referenced to the North American Datum, 1927. This was the Lambert Conformal Conic projection of the source quads. At this point, all of the digital alluvium contacts were geospatial.
We could now convert each digital quad file into the Universal Transverse Mercator coordinate system, as referenced to the World Geodetic System, 1984 (WGS84). This was done to satisfy the specifications of the U.S. Army Corps of Engineers for the deliverable GIS product. For quality assessment of the georeferencing process, we generated a graticule in the UTM coordinate system and overlaid it with the converted alluvium files. The graticule was created by using the Grid Generation function of MGE. Then we turned our attention to the nonalluvium (figure 5).
Figure 5. Scan of nonalluvial linework, Simpson South quadrangle. |
We digitized the scanned images of the nonalluvium quads by following the very same process that we used for the alluvium. Once the nonalluvium quads were georeferenced, they were overlayed with the alluvium, as reference files. Now, for the first time we were able to see all of the digital surface geology contact lines in their proper context, both as individual quads and in mosaic. So now, full-scale color plots could be made for the geologists to review.
At this point we should mention that, as a direct result of experience gained from this project, both alluvium and nonalluvium lines will be drawn manually on the same mylar sheets in future projects. This will greatly minimize the labor involved in the georeferencing and edgematching processes.
The results of the reviews by the geologists were mylar sheets of both the lines to be added and the lines to be deleted. The lines to be added were digitized, cleaned, georeferenced and overlayed with the alluvium and nonalluvium. Then flags could be placed around lines that were to be deleted. At this point in the GIS process, all the needed lines had been digitized, georeferenced, and reviewed by the geologists. The flags led us quickly to the lines to be deleted. The time had come to stitch all the panels and patchwork together, for edgematching--or had it?
In the past, the senior author has been quite frustrated, as no doubt have been many readers, to find that digital vector quadrangles don't usually mosaic seamlessly. Even though they have been edgematched, there will usually be a gap between adjacent quadrangles when one zooms in beyond the resolution of the data. In order to prevent the occurrence of these gaps we overlayed the graticule which we had previously generated using MGE's Grid Generation function. Now, the time had, finally, come to stitch all the digital linework together. We performed this operation by creating a new blank design file of the same projection, overlaying it with all of the design files for each of the ten quadrangles, turning on all layers in all files, and performing a fence copy of all the linework into the new blank design file.
Next, MGE's End Point Processor was used to flag all dangling ends for the alluvium and nonalluvium layers. All other layers were turned off, including the quad boundaries. And, with the interactive guidance of the geologists, the contacts were manually edgematched. This all-inclusive vector line file, of almost 30 MB, will be archived, as the master mosaic, for potential future data development, as well as for documentation of this work. From this master mosaic design file, only the desired layers were fence copied into ten new UTM, WGS84 design files. These layers included the alluvial and nonalluvial contacts, along with the graticule. From these layers the final polygons would be assembled.
After running the Duplicate Line Processor on each of these ten new design files, there were no duplicate lines, and intersections had been broken where the contacts crossed the graticule. Finally, the short segments outside the graticule were deleted from each of these new digital quads. At this point in the GIS compilation process, the line development was complete. The next task was to create topology.
Since our plan was to ultimately populate the database within ESRI's ArcView environment, our next step was to translate the final ten INTERGRAPH design files into ArcInfo coverages. We used ArcInfo's IGDStoARC translator to make the translations. After the translation, the projection had to be defined, since the IGDStoARC translator cannot translate the INTERGRAPH projection information. We then used the "Build" command in ArcInfo to construct polygon topology from the contact lines. If the process failed, that indicated that some duplicate lines still remained in the digital quad. In such a class, MGE's Duplicate Line Processor would be run again on the final design file, before attempting to translate again and build topology. Once polygon topology was constructed for the ArcInfo coverage, we simply "Added" it to an ArcView View window and "Converted" it into an ArcView shapefile.
Meanwhile, the GIS team had requested that the geologists label the review plots with the geologic-unit abbreviations. These labels were used by the GIS team as the source from which to populate the ArcView shapefile database. After populating the database with abbreviations, we sorted the "Area" field into ascending order, to facilitate finding any slivers that might exist. These slivers were "Unioned" with adjacent unit polygons, one by one, in ArcView. Finally, customized hues were created in ArcView for each geologic unit type. ArcView could then automatically render all the unit polygons, for each of the ten shapefiles, by reading the unit abbreviations within each shapefile database. At this point, the most difficult and time-consuming tasks were over. The remainder of the tasks began with one that we refer to as "polishing the databases." This was followed by creating ArcView layouts for maps-on-demand; creating metadata files; composing acknowledgments; formulating readme files; and recording and packaging of the CD-ROM. Discussion of these tasks is beyond the scope of this paper and, therefore, they are not here discussed in detail.
Hinds, D. J., 1997b, A report to accompany the geologic map, Slagle area, western Louisiana, scale 1:24,000: Unpublished report, Louisiana State University, Baton Rouge, 61 p. plus plates (includes one 1:24,000-scale geologic map).
Hinds, D. J., 1998a, Neogene Stratigraphy and Depositional Environments of the Fort Polk and Slagle Area, Western Louisiana: Louisiana State University M.S. thesis, 100 p. plus plates (includes two geologic maps at an approximate scale of 1:53,333).
Hinds, D. J., 1998b, Geologic map of the Fort Polk area, Vernon Parish, Louisiana: Louisiana Geological Survey, Geologic Quadrangle Map No. GQ-1, produced in cooperation with U.S. Geological Survey, EDMAP program, under assistance award no. 1434-HQ-96-AG-01535, scale 1:24,000.
Hinds, D. J., 1998c, Geologic map of the Slagle area, Vernon Parish, Louisiana: Louisiana Geological Survey, Geologic Quadrangle Map No. GQ-2, produced in cooperation with U.S. Geological Survey, EDMAP program, under assistance award no. 1434-HQ-97-AG-01753, scale 1:24,000.
Hinds, D. J., 1999, Neogene stratigraphy and depositional environments of the Fort Polk and Slagle areas of western Louisiana: Louisiana Geological Survey, Report of Investigations 99-01, 60 p. plus appendix.
McCulloh, R. P., and P. V. Heinrich, 1999, Geology of the Fort Polk region, Sabine, Natchitoches, and Vernon Parishes, Louisiana: Final report prepared for U.S. Army Corps of Engineers, Fort Worth District under contract no. DACA63-95-D-0051, delivery order no. 0008, 119 p. plus plates and appendices (includes one compact disc containing GIS files for geology, geologic hazards, and economic geology of ten 7.5-minute quadrangles at 1:24,000 scale).