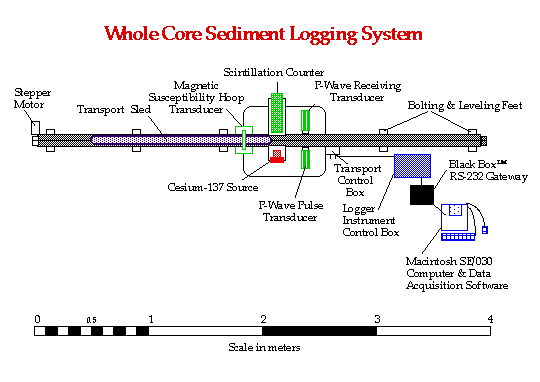
Overhead diagram of the Multi-Sensor core sediment Logging (MSL) device and computer system.
The multi-sensor whole core logging system (MSL) enables a number of physical property measurements to be made on unsplit sediment cores encased in cylindrical core liners (Cottage and Lane, 1990). Core sections of up to 1500-mm-long and 100 mm in diameter can be used. The system is designed to be operated either manually or under computer control, depending on the requirements and available peripheral equipment.
The measurement sensors on the whole core logger are:
- A pair of compressional (P) wave transducers to measure the velocity of compressional waves (sound) in the sediment.
- A gamma ray source and detector to measure the attenuation of gamma rays through the sediment, which is used to calculate the density of the sediment.
- A magnetic susceptibility sensor to determine the amount of magnetic material present in the sediment.
The unsplit sediment core is placed in a transport sled at one end of the tracking system and is aligned to its start position with one end of the core (normally the top) between the P-Wave Transducers (PWT). The core travels incrementally past or through the different sensors. After each increment of travel (typically 10 mm), readings from each of the sensors are taken. The process is repeated until the complete core has passed through the last sensor. In this way data from each of the sensors are obtained at a spatial resolution equal to the incremental travel distance. After removing the core, the transport sled is repositioned at the start position and is made ready for the next core section.
For this study, the logger was utilized in the automatic mode. After the core section was loaded onto the transport sled, the entire process was controlled by computer. Instructions are sent to control the core movement and data were sent from the sensors to the computer after each increment of travel. Kayan and Phi (1997) describe the HyperCard© HyperScan stack that provides the computer interface for logger control and data acquisition.
Summarized from Cottage and Lane (1990), the following is a brief description of the individual sensors on the core logger.
P-Wave Measurement System
The two compressional (P) wave transducers (PWTs) are identical apart from the connectors used. The transmitter is fitted with a standard coaxial cable, 'BNC' connector and 'Lemo' connector to minimize electrical interference. Each PWT contains a thickness mode 500 kHz piezoelectric crystal mounted in epoxy resin and housed in a stainless steel cylinder. A filled epoxy resin backing is used to shape the transmitted pulse. Each PWT acts as a spring-loaded piston within a plastic-cylinder mounting, the position of which can quickly and easily be altered to accommodate cores of different diameters. The spring-loaded transducers are mounted diametrically across the core and make direct contact with the core liner as it traverses along the track.
Operating Principle. A short 500 kHz P-wave pulse is produced at the transmitter at a repetition rate of 1 kHz. This pulse propagates through the core and is detected by the receiver. Pulse timing circuitry is used to measure the travel time of the pulse with a resolution of 50 ns. The distance traveled is measured as the core diameter with an accuracy of 0.1 mm. After suitable calibration procedures have been followed, the P-wave velocity can easily be calculated with a resolution of approximately 1.5 ms-1. The compressional wave velocity, Vp, is calculated from the measured core diameter and wave travel time, correcting for the liner thickness, electronic signal delays, and core liner travel time. Vp is calculated as:
Vp = f(d-2L,T-2Tliner-Tdelay)
Variables for the calculation are the liner thickness, d; the core diameter, L; the total travel time, T; the liner travel time, Tliner; and the electronic signal delay within the transducer, Tdelay (Kayan and Phi, 1997). The accuracy of the measurements will depend largely on any variations in liner wall thickness (which cannot be easily measured on a continuous basis). However, experience has shown that an absolute accuracy of +/- 3 ms-1 is normally achievable.
It is essential to maintain a good acoustic coupling between the transducer faces and the core liner. This is achieved by spraying the liner with a mist of fresh water. Good acoustic coupling is also required between the sediment and the liner; consequently, only high quality cores where the liner is full of sediment will provide consistently good data.
Back to Top
Gamma Ray Attenuation Measurement System
An Isotope Products Laboratory sealed-source Cesium-137 capsule (active element CsCl) is used as the gamma ray source. Cesium-137 has a half-life of 30.2 years and emits gamma rays principally at 0.662 MeV. The capsule, measured at 13.1 millicurie when delivered in 1991, is housed in a 70 mm diameter primary lead shield and collimator. The collimating hole is about 11mm in diameter and 52 mm long. An additional lead shield is fitted to the rear of the source and a lead cap is supplied to fit into and over the collimating hole when the source is not in use and for transport purposes.
A Harshaw type 6S6/1.5 NaI (Tl) scintillation detector is used for counting emitted gamma rays. The scintillation phosphor is a NaI (Tl) crystal 1.5" in diameter and 1.5" thick. It comes complete with a photomultiplier tube, dynode chain and connecting cable. The whole detector unit is mounted in a 100mm diameter collimated lead shielding.
Operating Principle. Both the source and detector are mounted diametrically across the core, such that they are as close to the core as is practical. A narrow beam of gamma rays is emitted from the source and passes across the diameter of the core. At this energy level in most geological materials, the primary mechanism for the attenuation of gamma rays is by Compton scattering. The incident photons are scattered by the electrons with a partial energy loss. The Compton attenuation, therefore, is directly related to the number of electrons in the path of the gamma ray beam.
Sediment bulk density (rb) is calculated from the gamma ray attenuation characteristics of the cores according to Lambert's Law (Kayan and Phi, 1997). For a defined period of time, the amount of gamma rays emitted from the source and received at the scintillation detector are counted. Lambert's Law states that:
I = Io exp {-mrbd},
where Io is the number of scintillation counts as an unattenuated measure (through air); I is the attenuated gamma ray counts (through sediment); d is the material thickness; and m is the Compton scattering coeffiecient (Kayan and Phi, 1997).
Back to Top
Magnetic Susceptibility Measurement System
A Bartington loop sensor (MS2B) is used for the magnetic susceptibility measurements. The sensor is mounted between the main tracking section in such a way that no magnetic components come within 200 mm of the sensor.
Operating Principle. A low intensity, non-saturating, alternating magnetic field (0.565 kHz) is produced by an oscillator circuit in the sensor. Any material in the near vicinity of the sensor that is susceptible to a magnetic field causes a change in the oscillator frequency. The electronics convert this pulsed frequency information into magnetic susceptibility values. Magnetic susceptibility of sediment is the measure of the degree to which ferromagnetic minerals within the sediment are influenced by a magnetic field.
Back to Top
Data Manipulation
A HyperCardTM interface to automate movement of core sections through the sensor-array, perform sensor data acquisition, and provide an intuitive, user-friendly interface, was developed by Rob Kayen and Thang Phi from the USGS. Once the core has completely traveled through the sensors, the HyperCardTM stack compiles the data into a text file. The data are then imported into KaleidaGraphTM 3.0, a graphing software program, in which data are reduced into a workable form. One drawback of the whole core logger system is not being able to acquire accurate data from the parts of the core which are covered by the end caps; they tend to send conflicting messages to the sensors because the caps add to the sediment diameter. Thus, anomalous values are frequently returned from the top and bottom of the core. Other anomalous values occur where pockets of gas or air are present in the core, or when there is not a good contact between the sediment and the core liner. These values are deleted before graphing the data, in order to produce a better representation of the sediment core. Graphs of velocity (km/s) and density (g/cc) vs. depth (cm) are made for each core using KaleidaGraphTM, a graphing program, and then imported into CanvasTM, a graphics software program, for presentation purposes.
Back to Top |