Skip past header information USGS Logo with Link to USGS Home Page
  Open File Report 01-499, Temporal Changes in Grain Size and Organic-Mineral Aggregates
Skip past header information
Title Page / Abstract / Introduction / Geologic / Methods / Results / Conclusions / Acknowledgments / References / Appendix 1


Figure 12.

Mud concentration(%) in core 3-3 collected on cruise w15 at USGS station 3 in Massachusetts Bay.
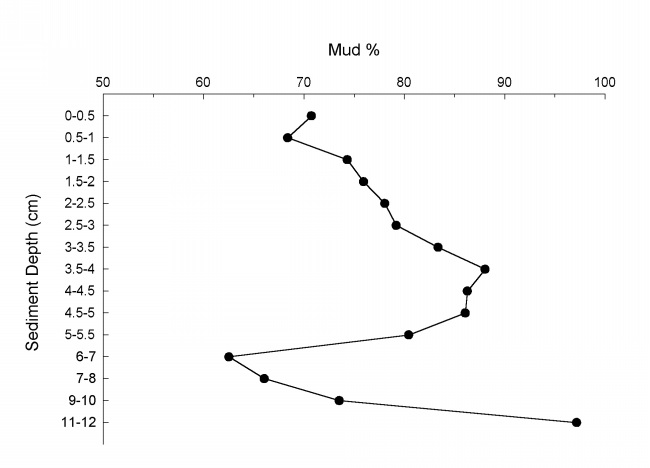
Figure 12 graph shows Sediment Depth centimeters (11-12 to 0-0.5) by Mud percent  (50 to 100).


Skip past header information Title Page / Abstract / Introduction / Geologic / Methods / Results / Conclusions / Acknowledgments / References / Appendix 1
[an error occurred while processing this directive]