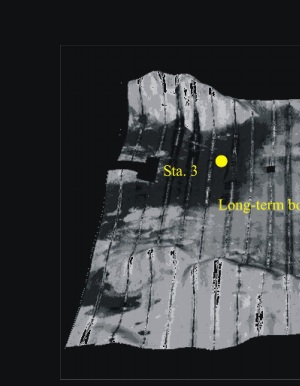
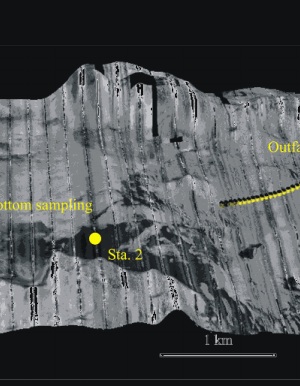
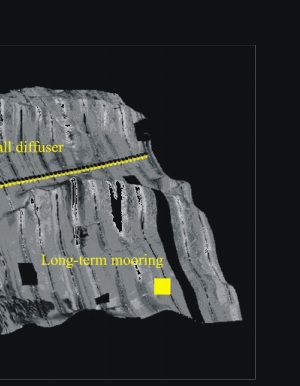
A sidescan sonar map (looking northward) depicting the bathymetry and locations of the two USGS long-term monitoring sites (stations #2 and #3) and their proximity to the outfall diffuser pipe.