Skip past header information USGS Logo with Link to USGS Home Page
  Open File Report 01-499, Temporal Changes in Grain Size and Organic-Mineral Aggregates
Skip past header information
Title Page / Abstract / Introduction / Geologic / Methods / Results / Conclusions / Acknowledgments / References / Appendix 1


Figure 8.

Mud concentration (%) in surface sediments (0-0.5 centimeter) collected from USGS station 3 in Massachusetts Bay.
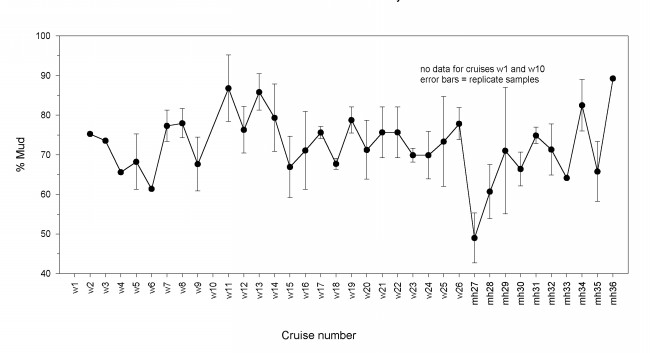
Figure 8 graph shows Percent Mud (40 to 100) by Cruise Number (w1 to mh36); no data for cruises w1, w5, w10, and w12; error bars equals replicate samples.


Skip past header information Title Page / Abstract / Introduction / Geologic / Methods / Results / Conclusions / Acknowledgments / References / Appendix 1
[an error occurred while processing this directive]