Skip past footer information
USGS Logo with lilnk to USGS Home Page
Contaminated Sediments Database for the Gulf of Maine, OFR 02-403

Lead Sample Population for Areas of the Gulf of Maine

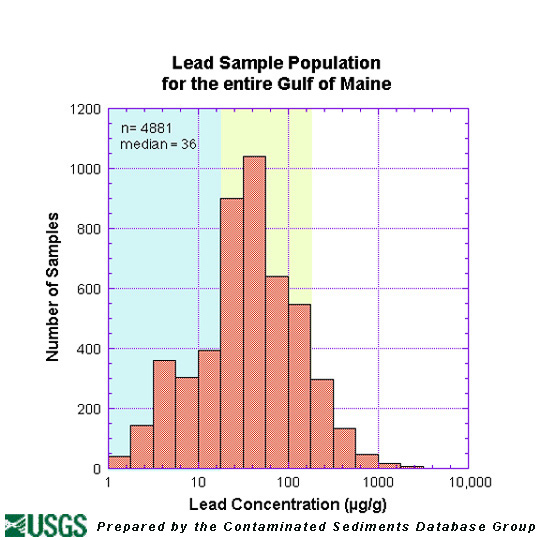
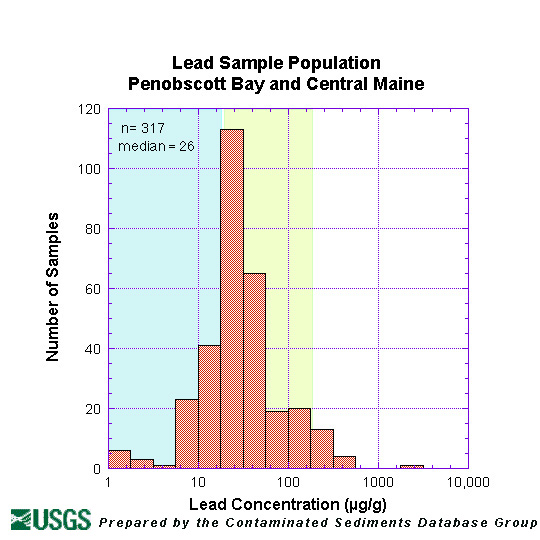
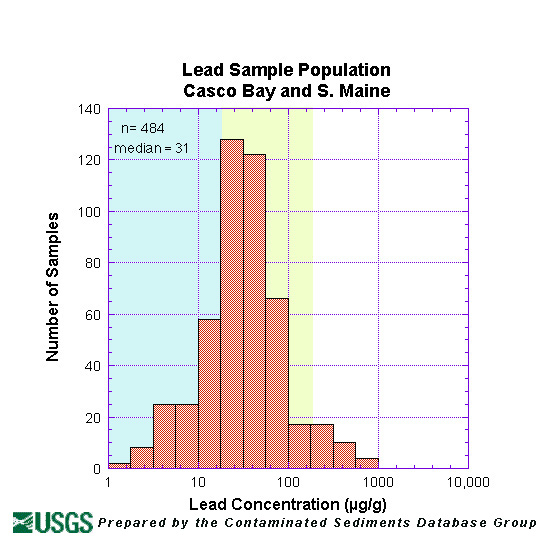
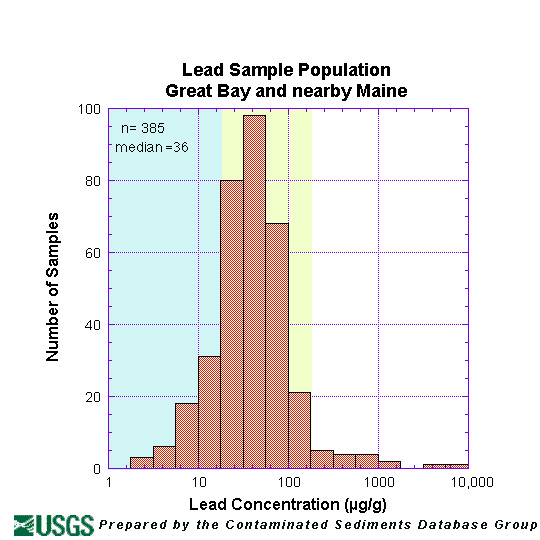
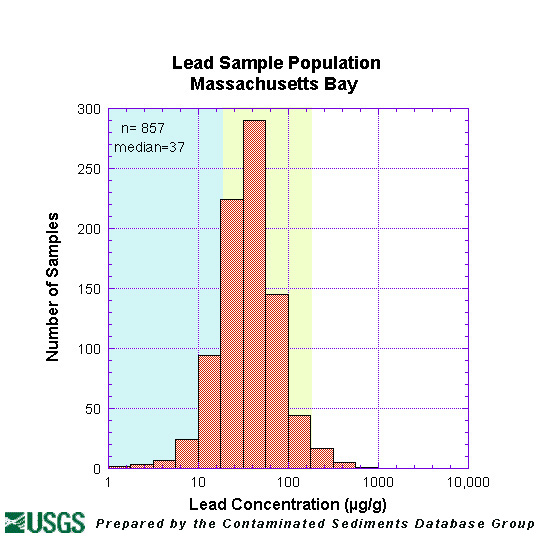
Figure 9: Histograms showing the distribution in the database for selected geographic areas.   Blue shading depicts the range of naturally-occurring background Pb concentration.   Yellow shading indicates the range of 10 times background.

Figure 9. Entire Gulf of Maine (109497 bytes), Link to larger image Figure 9. Penobscot Bay and Central Maine (101513 bytes), link to larger image Figure 9. Casco Bay and South Maine (107817 bytes), link to larger image
entire Gulf of Maine Penobscot Bay and
Central Maine
Casco Bay and S. Maine
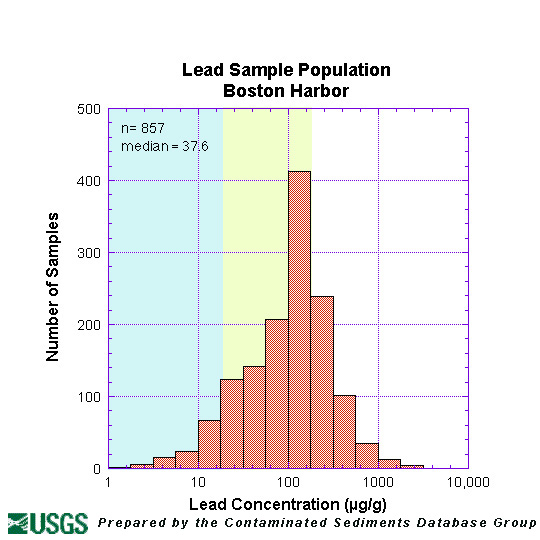
Figure 9. Great Bay and Nearby Maine (101655 bytes), link to larger image Figure 9. Massachusetts Bay (98880 bytes), link to larger image Figure 9. Boston Harbor (94219 bytes), link to larger image
Great Bay and nearby Maine Massachusetts Bay Boston Harbor

Skip past navigation information

Home  /  Site Map  /  Introduction  /  Overview  /  Contacts  /  DB Construction  /  Data Access  /  Data Utilization  /  Data Tables & Maps  /  Geographic Context/Links  /  References  /  Collaborators  /  Acknowledgements  /  Disclaimer
Skip past footer information

Department of Interior
> U.S. Geological Survey > Coastal and Marine Geology > Woods Hole Field Center

USGS Privacy Statement / Disclaimer / Accessibility
URL: https://pubsdata.usgs.gov/pubs/of/2002/of02-403/HTMLdocs/fig9.htm
Maintained by Eastern Publications Group
Modified Friday, 11-Jan-2013 03:31:06 EST