Open-File Report 03-383
by Jonathan R. Childs, Noah P. Snyder, and Margaret A. Hampton1
This report is preliminary and has not been reviewed for conformity with U.S. Geological Survey editorial standards
or with the North American Stratigraphic Code. Any use of trade, firm, or product names is for descriptive purposes
only and does not imply endorsement by the U.S. Government.
PDF version of this report (2.5 MB)
|
Figure 1: Upper Yuba River Watershed Studies Program (UYRSP) area. Small rectangle |
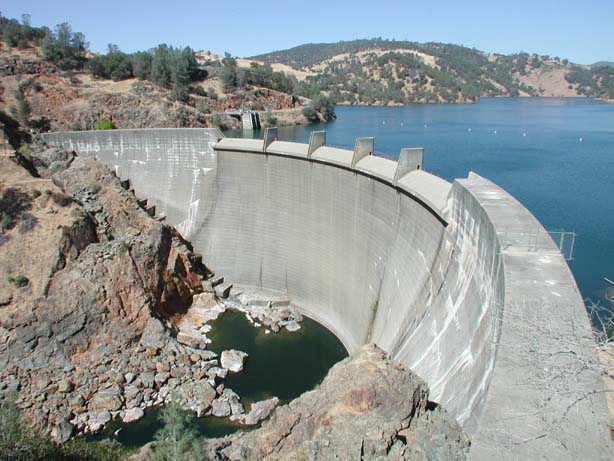
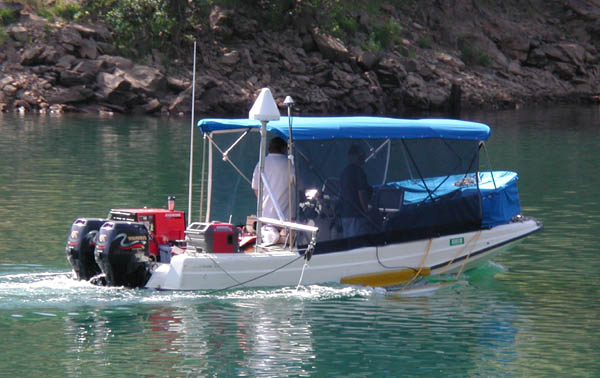
Harry L. Englebright Lake (Englebright Lake; Figure 1) is a 9-mile-long (14-kilometer) reservoir located in the Sierra Nevada foothills of northern California on the Yuba River gorge known as The Narrows. The reservoir is impounded by Englebright Dam (Photo 1), a concrete arch structure spanning 348 meters (1,142 feet) across and 79 meters (260 feet) high. The dam was constructed in 1941 for the primary purpose of trapping sediment derived from anticipated hydraulic mining operations in the Yuba River watershed. Hydraulic mining in the Sierra Nevada was halted in 1884 but resumed on a limited basis until the 1930's under the regulation of the California Debris Commission. Although no hydraulic mining in the upper Yuba River watershed resumed after the construction of the dam, the historical mine sites continued to contribute sediment to the river. Today, Englebright Lake is used primarily for recreation and hydropower. In 2001 and 2002, the U.S. Geological Survey (USGS) conducted bathymetric, geophysical, and geological studies of the reservoir under the auspices of the Upper Yuba River Studies Program (UYRSP), a multi-disciplinary investigation into the feasibility of introducing anadromous fish species to the Yuba River system upstream of Englebright Dam. A primary purpose of these studies was to assess the quantity and nature of the sediment that has accumulated behind the dam over the past 60 years. This report presents the results of those surveys, including a new bathymetric map of the reservoir and estimates of the total accumulated sediment volume. Photo 1. Englebright Dam and reservoir, looking north. Bathymetric surveys The principal bathymetric survey (USGS Field Activity ID F-1-01-NC ) was conducted in May, 2001, using the R/V Fast Eddy, a 22-foot Boston Whaler (Photo 2). The boat was equipped with a Lowrance LMS-130 digital fathometer, and a CSI DGPS Max global positioning system (GPS) satellite receiver. All data were logged with the USGS PC-based data acquisition package YoNav.
Photo 2. Research Vessel Fast Eddy, on Englebright Lake in May, 2001 The level of the reservoir varies due to releases from the dam and variable inflow. All measured depths were adjusted for reservoir level variation, which is monitored by the US Army Corps of Engineers and reported on-line at: In April, 2002, a second survey program (USGS Field Activity ID F-1-02-NC ) was conducted, primarily for the purpose of collecting reservoir bottom sediment samples and grain-size information, and in May, 2002, the reservoir sediments were drilled and continuously cored at 7 locations. In September, 2002, additional geophysical profiles were acquired. During the second field program, the depth in the deepest area of the reservoir just above the dam was measured with a bottom camera system (called the "flying eyeball"). This instrument consists of a video camera mounted within a steel ball that is lowered to the reservoir bottom with inelastic conducting cable. The cable was marked at the waterline when the camera was at the reservoir bottom according to the video camera, and the distance from the mark to the camera focal point was subsequently measured, resulting in a depth (uncorrected for reservoir level or vertical datum) of 59.1 meters (193.9 feet) compared to a depth of 59.5 meters (195.2 feet) measured with the Lowrance fathometer, a difference of 0.7%. It is therefore estimated that water depths measured with the fathometer are accurate to better than 60 centimeters (2 feet) in the deepest portion of the reservoir, and to approximately 15 centimeters (6 inches) in the shallower portions. Reflection profiling Prior to the field program, it was expected that seismic reflection profiling would be able to image the post-dam sediment accumulation and stratigraphy, down to the pre-dam river bed and perhaps even reveal the pre-dam river sediment to the bedrock interface. Several profiling methods were used to attempt to image the reservoir sediments. In 2001, Geopulse and Bubble Pulser sources were employed, received with both a short single-channel hydrophone streamer and a Seistec line-in-cone array. In 2002, an Edgetech 512 Chirp profiler was tested in the reservoir. The results of all profiling was similar: the reservoir bottom appears to be acoustically impenetrable. The only reflection events that can be reliably interpreted are the reservoir bottom, and the subsequent multiple reverberations from the reservoir bottom. No reflection events within or at the base of a sediment package could be identified. This surprising result remains unexplained. One possible explanation is a high concentration of biogenic gas in the sediment. The reservoir sediments are clearly gas charged, as evidenced by the frequent observance of gas bubbles in the reservoir. A uniformly high gas content would create a large acoustic impedance at the reservoir bottom, severely limiting the amount of transmitted energy. The geometry of the reservoir, consisting of a narrow and steep-sided canyon, also may degrade the amount of reflected energy returned. Pre-dam survey Topographic maps of the reservoir area with pre-dam elevations are on file at the U.S. Army Corps of Engineers offices at the reservoir headquarters. These 1:4800 maps are contoured at a 20-foot interval between 300 and 500 feet, and at a 10 foot interval between 500 and 600 feet. Swath bathymetry at dam In March, 1998, the engineering firm Chris Ransome & Associates Northwest (CRA-NW) was subcontracted by Bookman-Edmonston Engineering to conduct a swath bathymetry and subbottom profile survey of the reservoir in the area immediately upstream (about 500 feet, or 152 meters) of the dam. That survey reported a reservoir bottom elevation of between 330 and 335 feet (101 and 102 meters), which is slightly higher than the 325 to 327 foot (99.1 to 99.7 meter) elevation reported here. The CRA-NW used an average sound velocity of approximately 4,724 ft/s (1,440 m/s) (ranging between 4,718 and 4,767 ft/s or 1,438 and 1,453 m/s), compared with the constant velocity of 4,800 ft/s (1,463 m/s) used by the Lowrance fathometer. This 1.5% difference in the water velocity could account for a depth difference of 3 feet (90 centimeters) in 200 feet (61 meters) of water. The CRA-NW data were not incorporated into any of the results in this report. CRA-NW also acquired subbottom profile data in a small area immediately behind the dam. Those results showed sediment thickness up to 50 feet (15 meters) in the channel 500 feet (152 meters) upstream of the dam. The CRA-NW report acknowledged the difficulty of profiling in the reservoir, although surprisingly it concluded that there was little or no biogenic gas present in the reservoir sediments. Bathymetric map Approximately 18,500 depth points along the ship tracklines shown in Figure 2 were used to construct the surface of the reservoir floor. In the upstream end of the reservoir (on both the Yuba River and South Yuba River arms), the water was too shallow to survey. In each of these two areas, an artificial set of depth points (shown as green symbols in Figure 2) was estimated by linear interpolation along the river thalweg from the end of the boat survey to the point upstream on the pre-dam topographic map where the river bed elevation equals the dam spillway datum (160.6 m, 527.0 feet). These irregular x,y,z data points were gridded at approximately 6–meter (20–foot) grid interval using the blockmedian and surface algorithms in Generic Mapping Tools. The blockmedian algorithm filters and grids the input (x,y,z) data using L1 norm, and surface creates a continuous curvature surface. A tension value 0.4 was used in the surface process. The resulting reservoir bathymetry is shown in Figure 3.
Figure 2. Boat tracklines (in blue) along which reservoir depth (bathymetry)
Figure 3. Bathymetry of Englebright Lake in May, 2001. Predam elevation model The pre-dam topographic sheets encompassing the reservoir were scanned and the elevation contours from 300 to 550 feet vectorized using the Golden Software product Didger 3. The vectorized contours were then transformed from US State Plane 1927, California II coordinates to geodetic latitude, longitude, WGS 1984 using the Blue Marble Geographics product Geographic Calculator. These vectorized contours were then gridded and smoothed using the TOPOGRID function within the ESRI Arc Geographic Information System (ArcGIS). To create a hydrologically correct elevation model, a pre-dam river thalweg estimated from the pre-dam contour maps was also input to the TOPOGRID algorithm. The resulting pre-dam elevation grid (with 16-ft or 5-m cells) is shown in Figure 4.
Figure 4. Pre-dam elevations from survey by U.S. Army Corps of Engineers (1939). Sediment thickness The bathymetric and pre-dam elevation surfaces were calculated on coincident grids, so calculation of sediment thickness (isopach) was accomplished by simple grid subtraction. The resulting isopach map is shown in Figure 5. The figure clearly shows that the sediment is thickest (35 m; 115 ft) in the middle of the reservoir, and thins to between 20 and 33 ft (6 to 10 m) in the lower reach of the reservoir, including the area near the dam.
Figure 5. Sediment accumulation and erosion between 1941 and 2001. The vertical structure of the deposit is more clearly visualized on the longitudinal profile shown in Figure 6, where the pre-dam and reservoir floor surfaces have been extracted along the pre-dam Yuba River thalweg. The pre-dam river profile shown in Figure 6 includes the locations of the points where the thalweg crossed the original contour lines (every 10 or 20 feet in elevation). The excellent correspondence of the profile with these locations indicates that the TOPOGRID algorithm was faithful to the contour data. The small-scale noise in the profile data (approximately 3 feet, or 1 meter) is the result of sampling the thalweg line with 5-m (16-ft) grid cells. Through the present-day reservoir, the Yuba River had a mean gradient of 0.48%, with a maximum of 1.95% around 7 km (4 miles) from the dam. |
Figure 6. Englebright Lake longitudinal cross section.
The current reservoir-floor surface shown in Figure 6 has considerable small-scale variability – up to 30 ft (9 m) in elevation over distances of 650 to 1000 ft (200 to 300 m). These features may result from a combination of factors: (1) the profile is selected along the pre-dam river thalweg, because no corresponding center line exists for the reservoir floor; (2) the reservoir-floor surface has probably scoured depressions at some locations; and (3) fluvial incision of the upstream part of the deposit during reservoir drawdowns may produce irregular, high-relief surface. In spite of this high-frequency variability, the reservoir-floor profile clearly shows that the deposit has a deltaic form, with a relatively gradual upstream section (mean gradient 0.13%), a steep front (maximum gradient 6.55% over the interval from 5,500 to 5,700 m from the dam), and a lower section that reflects the pre-dam river gradient (0.45%). This form is consistent with sediment accumulation by the growth of a prograding river delta, with the upper part modified by fluvial processes during reservoir drawdowns. This interpretation is supported by preliminary observations of the reservoir sediments from coring data (Snyder and others, 2002), with mostly sand and gravel in the high-energy, fluvial upper part, and silt and clay transported in suspension in the lower part of the reservoir. Comparison of sediment thickness with sediment coring In May–June 2002, seven locations in the reservoir were cored and sampled (Table 1; Figures 6–7; Snyder and others, 2002). At each location up to six parallel holes were made, penetrating the entire post-reservoir sediment section at six of the locations. Detailed results of the coring program and analysis of the sampled material will be presented elsewhere. Table 1 shows the locations and compares the reservoir-floor and pre-dam surface elevations for 23 boreholes with values from the bathymetric and pre-dam elevation grids at the same locations. The positions of the boreholes were measured with DGPS by surveying the four corners and center of the drill rig (about 6 m; 20 feet long). The range of estimates of the model values for the holes reflects the values at each of the five DGPS locations on the rig, providing an estimate of the uncertainty in the surface elevation at each hole. The mean cored intervals for each of the seven locations were projected onto the thalweg closest to their location, and plotted on the longitudinal cross section (Figure 6). The thalweg is by definition the deepest part of the pre-dam river, so in every case the value of the pre-dam profile at each coring location is lower than the model values on Table 1.
Figure 7. Coring locations and regions used for volume estimates. At each hole the depth from the reservoir surface to the reservoir floor was measured using a weighted rope. These depths were subsequently corrected for changes in the reservoir level (with the assumption that the reservoir surface is flat), and converted to elevations relative to sea level (Table 1). The field-measured reservoir floor elevations are 0.4 m (1.3 ft) higher to 2.3 m (7.6 ft) lower than the corresponding mean grid locations, with a mean difference of –0.9 m (–2.8 ft) and a standard deviation of 0.6 m (2.0 ft). In all but two holes, the measured reservoir floor elevation is lower than the model value from the bathymetric surveys. This systematic discrepancy may be the result of one or both of the following factors: (1) the presence of a transitional fine-grained sediment slurry layer at the sediment-water interface that acts as a reflector for soundings, but was not identified using the weighted rope; or (2) overestimation of the water depth in the field due to the rope line not oriented exactly vertical . At 20 of the 23 holes, the pre-dam surface was identified by coring to an impenetrable layer, interpreted as the cobbles, boulders and bedrock of the pre-dam river surface (Table 1). In a few cases, sections of rock were recovered in the coring equipment. During coring, efforts were made to locate the boreholes in the thickest sediment sections, along the pre-dam river thalweg. Holes with a particularly large range of pre-dam model surface elevations (>2 m, e.g. 1D, 6D, 7A, 7B, 7C, 8A) penetrated areas on the steep sides of the canyon, not in the flat river valley. The cored pre-dam elevation ranged from 4.3 m (13.9 ft) above to 7.2 m (23.8 ft) below the mean model surface, with a mean difference of –0.4 m (–1.2 ft) and a standard deviation of 3.2 m (10.5 ft). The differences are generally similar at each coring location, with close correspondence between the cored and grid elevations at sites 4 and 9, lower cored elevations at sites 7 and 8, and higher cored elevations at sites 1 and 6. These discrepancies could result from a variety of factors including: (1) uncertainty in the depth of the impenetrable layer identified on the coring rig because of problems with incomplete core extension and/or sediment recovery; (2) imprecision in the original pre-dam contour maps; or (3) small-scale relief on the pre-dam river surface not included on the maps (for example scour holes in the river bed, bars, floodplains, or terraces). |
| site / hole | latitude (WGS84) (°) |
longitude (WGS84) (°) |
measured reservoir floor elevation (m) | cored pre-dam elevation (m) | model reservoir floor elevation, mean (m) | model reservoir floor elevation range (low - high, m) | model pre-dam elevation, mean (m) | model pre-dam elevation range (low - high, m) | measured minus model reservoir floor (m) | cored minus model pre-dam (m) | notes |
|---|---|---|---|---|---|---|---|---|---|---|---|
| 1A | 39.24540 | -121.26865 | 99.3 | 93.0 | 100.8 | 100.7 - 100.9 | 91.5 | 91.5 - 91.5 | -1.6 | 1.5 | location based on 2 DGPS points |
| 1B | 39.24543 | -121.26875 | 99.1 | 93.3 | 100.4 | 100.3 - 100.7 | 91.5 | 91.5 - 91.5 | -1.3 | 1.8 | |
| 1C | 39.24545 | -121.26879 | 99.3 | 93.4 | 100.4 | 100.3 - 100.6 | 91.5 | 91.5 - 91.6 | -1.1 | 2.0 | |
| 1D | 39.24536 | -121.26852 | 99.1 | 92.3 | 101.5 | 100.9 - 102.1 | 93.4 | 91.6 - 95.1 | -2.3 | -1.1 | |
| 1 mean | 39.24541 | -121.26868 | 99.2 | 93.0 | 100.8 | 100.6 - 101.1 | 92.0 | 91.5 - 92.4 | -1.6 | 1.1 | site 1 water depths measured w/ fathometer |
| 6A | 39.25782 | -121.25972 | 108.4 | 101.0 | 109.8 | 109.6 - 110.0 | 99.6 | 98.9 - 100.4 | -1.4 | 1.4 | |
| 6B | 39.25779 | -121.25963 | 109.2 | 102.7 | 110.1 | 110.0 - 110.2 | 100.5 | 99.7 - 101.0 | -0.9 | 2.2 | |
| 6D | 39.25767 | -121.25962 | 109.3 | 104.9 | 110.4 | 110.0 - 111.1 | 100.7 | 99.6 - 102.0 | -1.1 | 4.3 | |
| 6E | 39.25795 | -121.25999 | 109.6 | 101.7 | 109.6 | 109.6 - 109.7 | 98.0 | 97.8 - 98.3 | 0.0 | 3.7 | |
| 6F | 39.25787 | -121.25994 | 109.7 | 101.3 | 109.6 | 109.4 - 109.7 | 98.3 | 97.8 - 98.9 | 0.2 | 3.0 | |
| 6 mean | 39.25780 | -121.25978 | 109.3 | 102.3 | 109.9 | 109.7 - 110.1 | 99.4 | 98.8 - 100.1 | -0.6 | 2.9 | |
| 4A | 39.27585 | -121.25922 | 125.4 | 111.2 | 127.0 | 126.9 - 127.1 | 111.8 | 111.7 - 112.0 | -1.6 | -0.7 | |
| 4B | 39.27599 | -121.25928 | 127.5 | 110.3 | 127.1 | 127.0 - 127.1 | 111.2 | 111.1 - 111.4 | 0.4 | -0.8 | |
| 4C | 39.27597 | -121.25933 | 127.1 | 110.7 | 127.1 | na | 111.1 | na | 0.0 | -0.4 | location based on 1 GPS point |
| 4D | 39.27600 | -121.25933 | 126.9 | 110.7 | 127.1 | 127.1 - 127.2 | 111.3 | 111.1 - 111.5 | -0.2 | -0.5 | |
| 4 mean | 39.27595 | -121.25928 | 126.7 | 110.7 | 127.1 | 127.0 - 127.1 | 111.3 | 111.3 - 111.6 | -0.4 | -0.6 | |
| 7A | 39.27904 | -121.24922 | 146.5 | 134.6 | 147.1 | 147.0 - 147.3 | 123.7 | 121.1 - 127.2 | -0.7 | na | did not core to pre-dam surface, hole paired w/ 7B |
| 7B | 39.27906 | -121.24920 | 146.5 | 115.5 | 147.2 | 146.9 - 147.3 | 122.7 | 121.1 - 124.3 | -0.7 | -7.2 | continuation of 7A |
| 7C | 39.27904 | -121.24933 | 146.3 | 113.4 | 147.0 | 146.9 - 147.3 | 117.7 | 116.2 - 121.1 | -0.8 | -4.3 | |
| 7 mean | 39.27906 | -121.24921 | 146.4 | 114.4 | 147.1 | 147.0 - 147.3 | 121.4 | 119.5 - 124.2 | -0.7 | -5.8 | |
| 9A | 39.28390 | -121.23751 | 150.0 | 125.9 | 150.9 | 150.9 - 151.0 | 126.8 | 126.7 - 127.0 | -0.9 | -0.9 | |
| 9B | 39.28389 | -121.23766 | 150.1 | 126.5 | 151.0 | 150.9 - 151.0 | 126.7 | 126.7 - 126.7 | -0.9 | -0.2 | |
| 9C | 39.28381 | -121.23755 | 149.9 | 126.6 | 151.0 | 150.9 - 151.0 | 126.5 | 126.2 - 126.7 | -1.0 | 0.1 | |
| 9 mean | 39.28387 | -121.23757 | 150.0 | 126.4 | 151.0 | 150.9 - 151.0 | 126.7 | 126.5 - 126.8 | -0.9 | -0.3 | |
| 8A | 39.28268 | -121.22710 | 150.4 | 126.4 | 151.1 | 151.1 - 151.2 | 133.3 | 132.0 - 134.6 | -0.7 | -6.9 | |
| 8B | 39.28277 | -121.22717 | 150.6 | 140.5 | 151.5 | 151.4 - 151.5 | 131.2 | 131.0 - 131.4 | -0.9 | na | did not core to pre-dam surface, hole paired w/ 8C, location assumed to be approximately the same as 8C |
| 8C | 39.28277 | -121.22717 | 150.3 | 127.0 | 151.5 | 151.4 - 151.5 | 131.2 | 131.0 - 131.4 | -1.2 | -4.2 | continuation of 8B |
| 8 mean | 39.28266 | -121.22710 | 150.4 | 126.7 | 151.4 | 151.3 - 151.4 | 131.9 | 131.4 - 132.5 | -0.9 | -5.5 | |
| 2B | 39.29522 | -121.21050 | 156.8 | 150.5 | 157.5 | 157.2 - 157.9 | 139.4 | 139.7 - 139.3 | -0.7 | na | did not core to pre-dam surface |
| overall mean | -0.8 | -0.4 | |||||||||
| overall standard deviation | 0.6 | 3.2 | |||||||||
| Explanation: Italics indicate that the pre-dam surface was not reached, these values are not included in means. na, not applicable. | |||||||||||
|
Sediment volume calculations Using the midpoints between the seven coring locations, seven regions of the reservoir were defined for the sediment volume calculation (Figure 7). An eighth region (U) was defined to include the shallowest, unsurveyed areas; for these unsurveyed reaches of the Yuba and South Yuba Rivers, the water depth was extrapolated to 0 at the 527 foot (160.6 meter) elevation. Table 2 shows the volume, area, and reach of the regions of the reservoir. To calculate the sediment volumes and region areas, the reservoir was divided into nine polygons using ArcGIS. The reach lengths for each region were calculated along the pre-dam river thalweg. The original volume of the reservoir (calculated using the pre-dam elevation model) is 85,970,000 cubic meters (69,700 acre-feet), which compares well with the storage capacity of the reservoir of 86,000,000 cubic meters (70,000 acre-feet) published at http://cdec.water.ca.gov/misc/resinfo.html. Because the reservoir now contains 21,890,000 cubic meters (17,750 acre-feet) of sediment (Table 2), the storage capacity has been reduced by 25.5%. |
| region | reach (m) | area (m2) | volume (m3) | volume (acre-feet) | average thickness (m) |
|---|---|---|---|---|---|
| 1 | 1,595 | 739,000 | 2,420,000 | 1,960 | 3.3 |
| 6 | 2,252 | 857,000 | 3,410,000 | 2,770 | 4.0 |
| 4 | 1,761 | 474,000 | 2,910,000 | 2,360 | 6.1 |
| 7 | 1,145 | 232,000 | 3,470,000 | 2,820 | 15.0 |
| 9 | 1,110 | 175,000 | 2,260,000 | 1,830 | 12.9 |
| 8 | 1,646 | 187,000 | 2,380,000 | 1,930 | 12.7 |
| 2 | 3,029 | 378,000 | 3,470,000 | 2,810 | 9.2 |
| U | 4,553* | 306,000 | 1,570,000 | 1,270 | 5.1 |
| total | 3,348,000 | 21,890,000 | 17,750 | ||
| reservoir capacity | 85,970,000 | 69,700 | |||
| * Includes both the Yuba River and South Yuba River. | |||||
Figure 8. Transverse cross sections of lake floor and pre-dam elevation models at coring locations, from upstream (Site 2) to downstream (Site 1) . The USGS is planning to remap the reservoir bathymetry using a phase-discrimination wide-swath sonar system. This mapping produces both continuous swath bathymetry with a lateral resolution of better than 20 cm (8 in), as well as sidescan backscatter images. Another attempt to image the subbottom by seismic reflection profiling using different acoustic sources is also under consideration. The authors would like to thank: Larry Kooker, Gerald O'Brien, Patrick Hart, Hank Chezar, Tom Reiss, Mike Boyle, and Walt Olson (all of the USGS) for their assistance in conducting the field programs; Brian Haskell (University of Minnesota), the staff of DOSECC Incorporated, and numerous other USGS personnel for their work on the coring project; and Amy Foxgrover, Gerald Hatcher, and Shawn Higgins (all of the USGS) for assistance with ArcGIS. Peter Triezenberg assisted with the preparation of the final web presentation of the report. This report benefitted from reviews by David Rubin and Charles Alpers. Chris Ransome & Associates, 1998, Bathymetric, subbottom and sidescan survey in Marysville, California on Narrows Dam for Bookman-Edmonston Engineering, Final Report, May 18, 1998, CRA Job# 98011, unpublished Snyder, Noah P., Rubin, David M., Alpers, Charles N., Flint, Lorraine E., Curtis, Jennifer A., Childs, Jonathan R., and Haskell, Brian J., 2002, A record of rapid fluvial sedimentation in the Sierra Nevada hydraulic mining region: preliminary results from the 2002 Englebright Lake coring project; Paper No. 78-2, Geological Society of America 2002 Annual Meeting, Denver, CO Snyder, Noah P., Childs, Jonathan R., Hampton, Margaret A., Rubin, David M., Alpers, Charles N., Flint, Lorraine E., Curtis, Jennifer A., Wright, Scott A., and Topping, David J., 2003, The history and future of sediment deposition behind Englebright Dam, Yuba River, Northern California; Paper No. 140-5, Geological Society of America 2003 Annual Meeting, Seattle, WA RELATED LINKS Upper Yuba River Studies Program For questions about the content of this report contact This report is available only on the Web |

![]() U.S. Department of the Interior |
U.S. Geological Survey
U.S. Department of the Interior |
U.S. Geological Survey
URL: http://pubsdata.usgs.gov/pubs/of/2003/0383/intro.html
Page Contact Information: GS Pubs Web Contact
Page Last Modified: Monday, 07-Apr-2014 14:59:32 EDT