OF 03-150 Home
CD-ROM
Contents
Project
Description
GIS Data
Contacts
|
Methods
Click on each figure below to view larger
image. Click on figure number to go to figure-caption page for links
to images in PDF format and for further explanation of the images.
The seismic-reflection, sidescan-sonar, and bathymetric data were
acquired using an Edgetech
424 chirp subbottom profiler, an Edgetech
DF-1000 dual-frequency (100/500 kHz) sidescan-sonar, and an SEA
Submetrix Series 2000 swath bathymetry sonar (234 kHz) systems,
respectively.
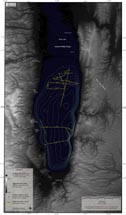
Chirp subbottom data (Figure 2) were recorded at a 125 ms sweep rate and a
25K sample rate and logged using Triton-Elics
Delph SeismicTM acquisition software. The chirp data
were processed using Colorado School of Mines Seismic
UNIX seismic processing software. Processing consisted of converting
the Triton-Elics SEG-Y format to Seismic UNIX format, stripping the
navigation from the headers, and applying an automatic gain
control to the data from 0 - 50 ms and 0 - 80 ms, depending on the
amount of penetration. Seismic Unix files were then plotted in postscript
and JPEG formats.
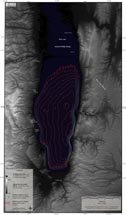
Sidescan-sonar data (Figure 3) were acquired at a 0.125 second ping rate,
yielding a 400 m swath. These data were logged
digitally at a 2K sample rate using
Triton-Elics ISISTM acquisition package. The data were
then processed using USGS software packages XSonar and ShowImage
to correct radiometric and geometric distortions inherent in the sidescan-sonar data. Geomatica
TM Software Solutions was used to generate a sidescan-sonar
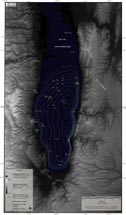
mosaic. The mosaic was then used as a base from which sample locations
were chosen. Nineteen grab samples were acquired using a Van Veen
grab sampler in order to ground-truth the various backscatter regimes
present within the sidescan-sonar data (Figure
4).
Bathymetric data were
acquired at a 0.133 second ping rate and logged at a 2K sample rate
using the SEA RTS2000 acquisition software. A TSS DMS2-05 Motion
Reference Unit (MRU) mounted directly above the Submetrix Series 2000
transducers measures all motion (pitch, roll, heave, and yaw) of
the vessel.
Precise measurements were taken prior to survey operations to record
the offsets between the navigation antenna and the MRU (the MRU
is treated as the reference location for all systems). The Wide
Area Augmentation System (WAAS) was utilized for navigation, yielding
horizontal accuracies of less than 3 meters.
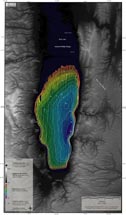
Bathymetric swath width varied as a function of depth, ranging
from ~20 times water depth in 10 meter water depth and shallower,
to ~4-5 times water depth in 40 meter water depth and deeper (Figure 5). The
bathymetric data were processed using the SEA RTS2000 acquisition
software. Processing consisted of filtering the raw data to eliminate,
or reduce, noise and outliers, while accounting for sensor position
and other real world offsets and adjustments. Additionally, eighteen
sound velocity profiles were collected in order to model the structure
of the water column (i.e. variations in speed of sound throughout
the water column) (Figure 5). Corrections were applied to the bathymetric data
to account for refraction of the acoustic wavefront due to speed
of sound variations. The processed data were then gridded at a 10
meter grid cell size using SEA Submetrix GRID2000 program. The data
were exported in ASCII x,y,z format. Interactive
Visualization Software (IVS) Fledermaus software package was
used to interpolate the data to fill in between-line gaps in bathymetric
coverage and to display the bathymetric and sidescan-sonar data
in 3-D.
To view files in PDF format, download free copy of Adobe Acrobat Reader www.adobe.com/products/acrobat/alternate.html.
|