Organics
Table Introduction
to the Organics Tables
The Organics Tables in the Long Island Sound and New York Bight Contaminated Sediment Database comprise three separate tables: 1) General Organics, 2) PCBs and Pesticides and 3) PAHs. The tables are stored within the MS Excel 2000 master file describing concentrations of organic substances in samples collected within the region.
Unique Identification Numbers (Unique ID#) allow the user to access additional information from other tables in the database. The General Organics table contains 13 parameters describing general organic contaminants. The PCBs and Pesticides table records 20 different PCB congeners, including 7 Arochlors, as well as 28 pesticide parameters. The PAH table contains 43 PAH parameters.
These tables should be used independently to assess data quality by examining the qualifiers given with each analysis. It is VITAL that this quality assurance step be taken prior to using data for scientific and interpretive purposes! Methodologies are defined for most sample analyses; however, reported methods vary widely. Additionally, accurate quantitation at low concentration levels is difficult, due to a variety of factors including lack of pure standard reference material, separation techniques in which there are co-eluting compounds, interfering co-extracted materials, etc. Consequently, comparison of separate data sets should be carried out with extreme caution.
Before
downloading the organics data, please read Organic
Contaminant Analysis: In flux with time (204 KB, PDF format),
which describes the difficulties in merging data sets with varying methodologies.
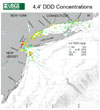
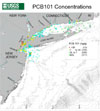
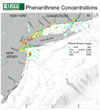
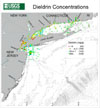
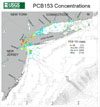
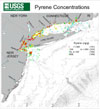
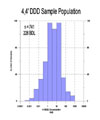
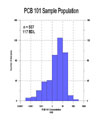
Once the user is satisfied with the data selection, the organic contaminant data tables may be used in conjunction with information from the Station table (e.g. latitude and longitude) to illustrate the geographic distribution of the sample concentrations. Examples of plots and graphs that describe the organics data are displayed below.
Organics
Table Plots and Graphs
| Concentrations |
| |
|
|
| 4,
4' DDD | PCB
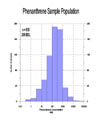
101 | Phenanthrene |
| |
|
|
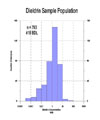
| Dieldrin |
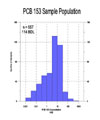
PCB
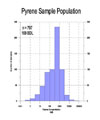
153 | Pyrene |
| | | |
| Sample
Populations | | |
|
|
| 4,
4' DDD | PCB
101 | Phenanthrene |
| |
|
|
| Dieldrin |
PCB
153 | Pyrene |
Download/view the Tables of Organics Information
Filename: GenOrgs.txt (Tab Delimited Text)
File Size: 591 KB
Filename: PCB_Pest.txt (Tab Delimited Text)
File Size: 1274 KB
Filename: PAHs.txt (Tab Delimited Text)
File Size: 782 KB
|
To view files in PDF format, download free copy of Adobe Acrobat Reader. |