
CHAPTER 1. INTRODUCTION AND BACKGROUND
| 1.1. Project Overview | 1.2. Orange County Sanitation District (OCSD) Operations | 1.3. Discharge Processes and Effluent Characteristics | 1.3.1. Ocean Discharge Processes | 1.3.2. Effluent Characteristics | 1.4. Huntington Beach Phase III (HBIII) Hypotheses | 1.4.1. Hypothesis Overview | 1.5. Huntington Beach Phase III (HB PIII) Program Elements | 1.6. References |
Home
Chapter 1. Introduction and Background
Chapter 3. Surfzone Bacteria Patterns
Chapter 4. Subtidal Circulation Pathways
Chapter 5. Newport Canyon Transport Pathway
Chapter 7. Tidal Transport Pathways
Chapter 8. Sediment Resuspension and Transport near the OCSD Outfall
Chapter 9. Nearshore Circulation and Transport Pathways
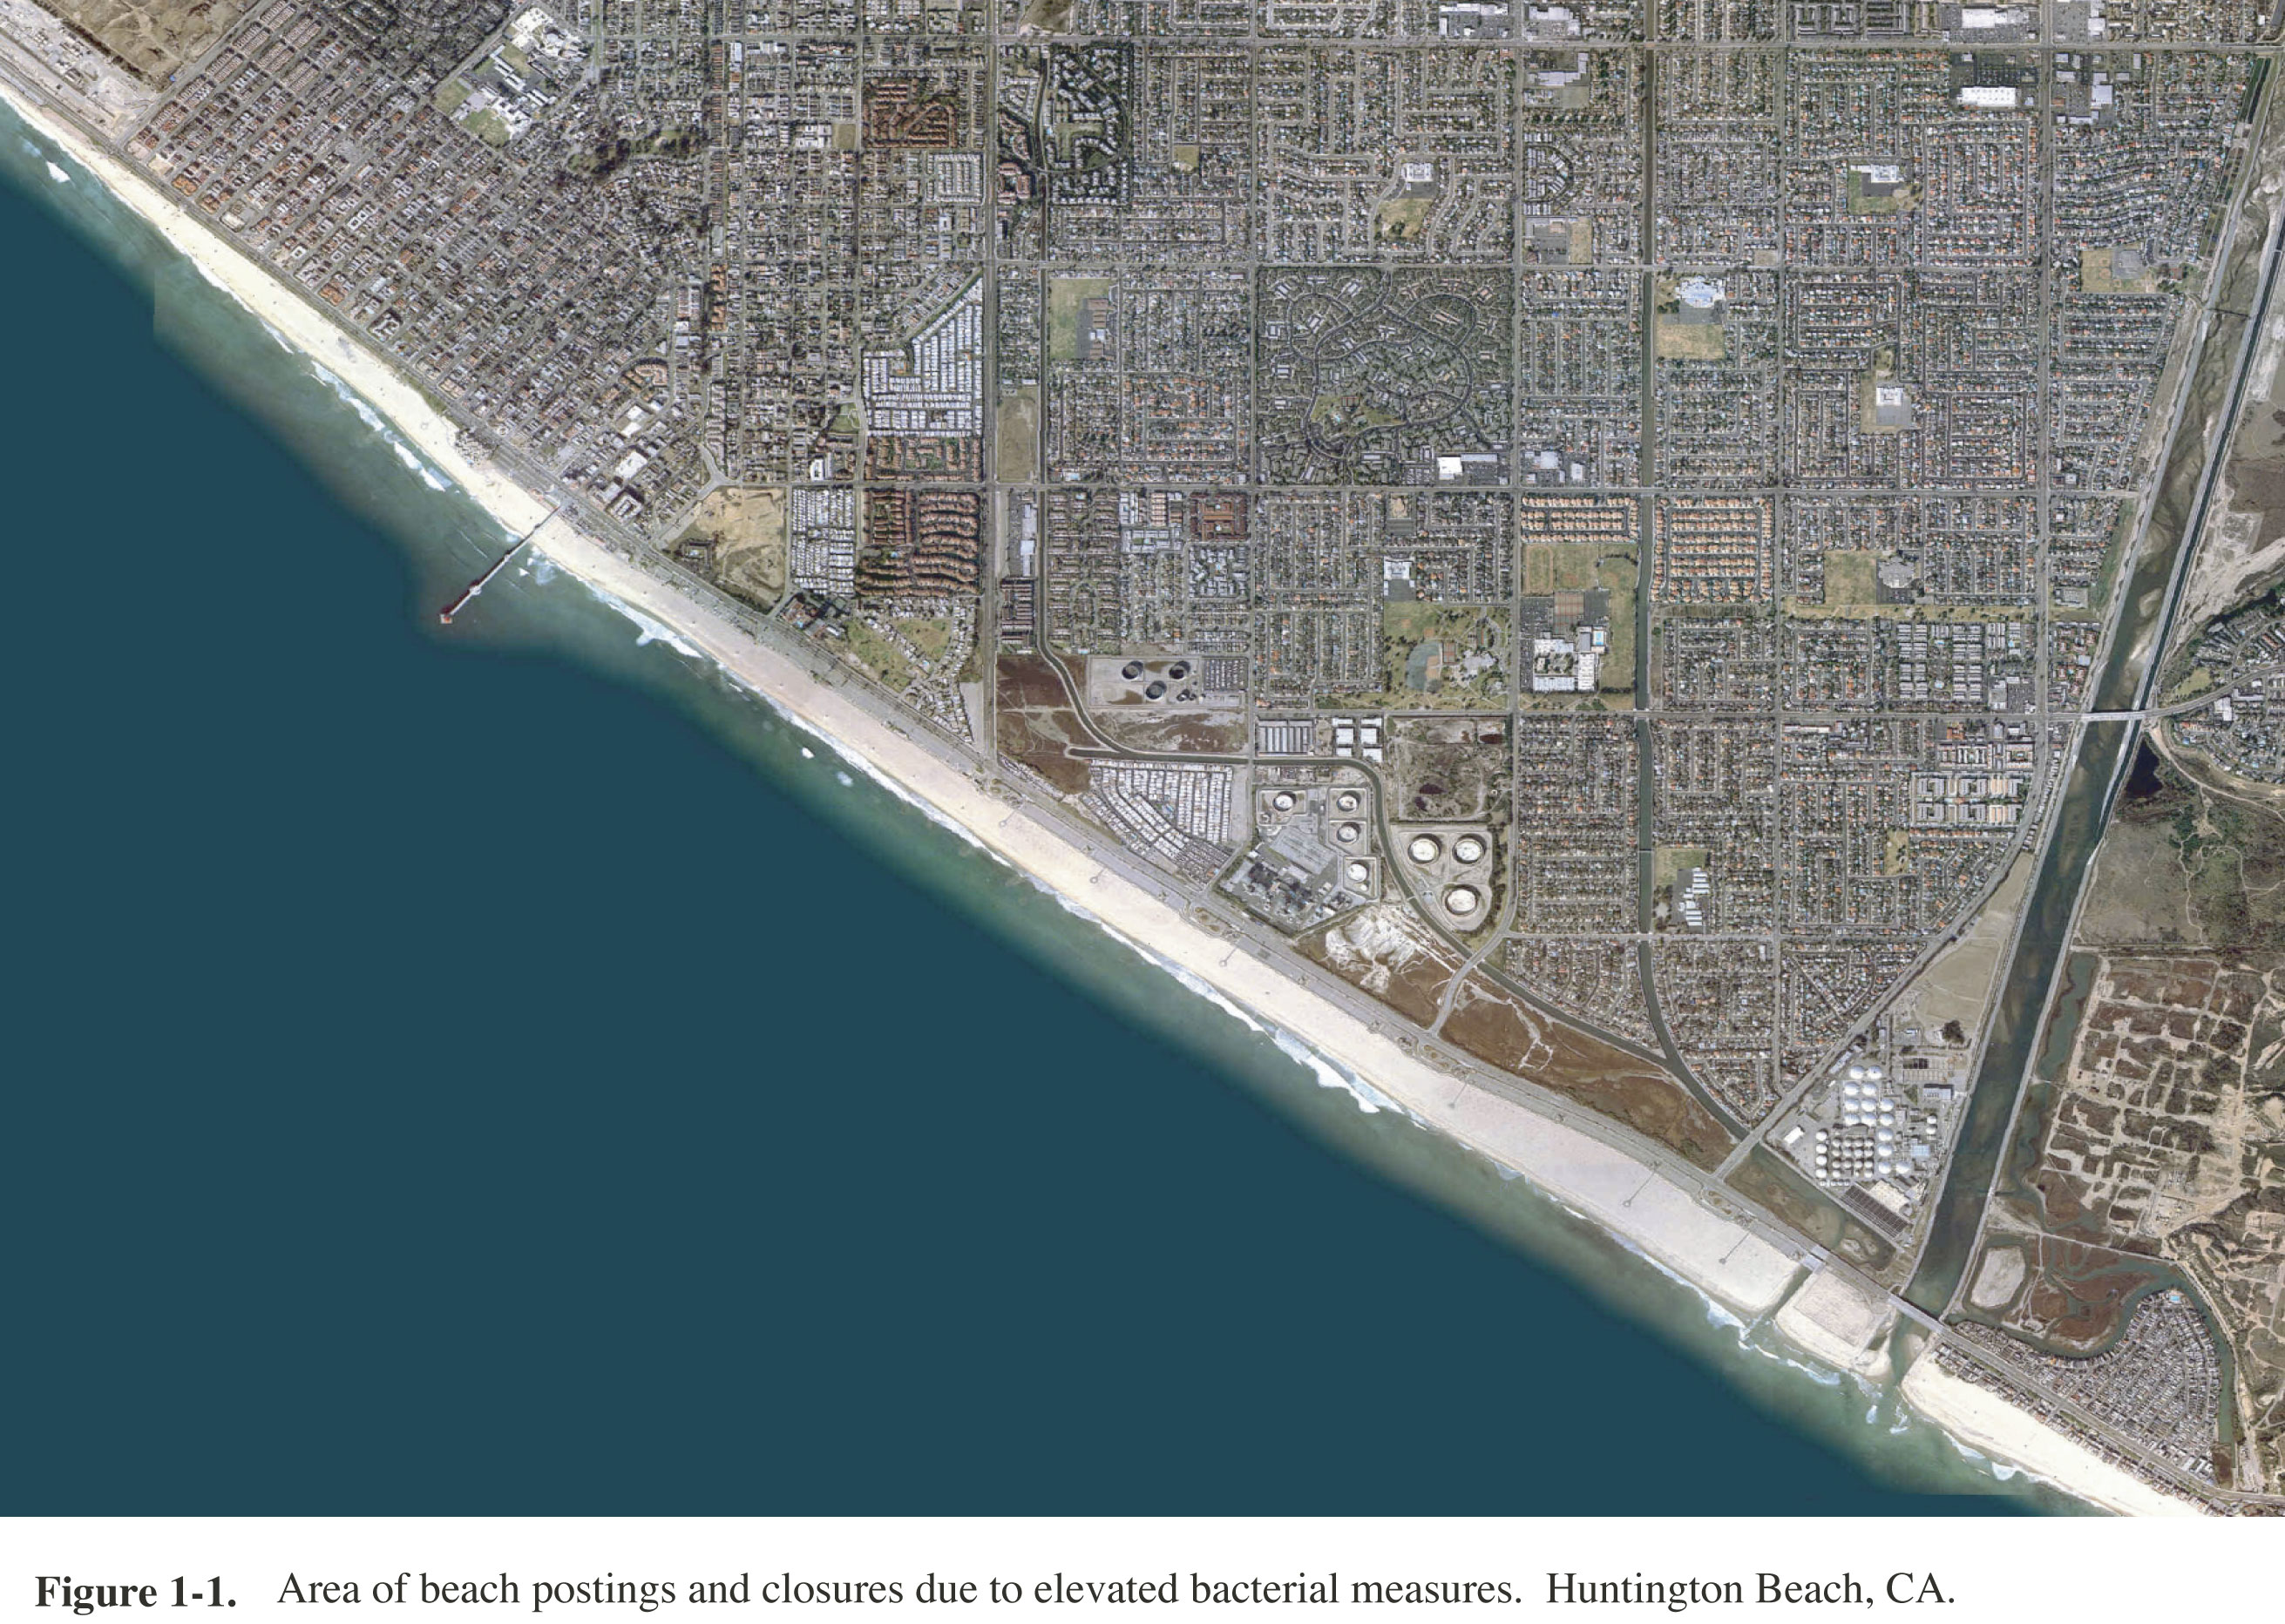
In July 1999, the Orange County Health Care Agency (OCHCA) began a series of beach closures in Huntington Beach, California (Figure 1-1), due to levels of total coliform, fecal coliform, and enterococci bacteria that exceeded newly applied beach sanitation AB411 standards (Table 1-1). (The actual implementation date for AB411 was July 27, 1999.) The OCHCA began closing beaches on July 3, 1999, because the level of contamination was thought to be of sewage origin, and was indicative of human sewage contamination. Since that time, surfzone bacterial levels from Orange County Sanitation District’s (OCSD) monitoring stations located north of the Santa Ana River and, in particular, at sites near and adjacent to the AES Corporation’s Huntington Beach power generation plant have continued to exceed the AB411 standards on some days during the summer. Beginning in 1999, many land, estuarine, and coastal ocean-based studies were conducted to identify the source or sources of the bacteria (Table 1-2). These investigations suggested that the elevated bacteria levels occurred primarily during late spring and summer and coincided with periods of maximum tidal range (i.e., spring tides). Grant et al. (2000) identified the offshore wastewater discharge from OCSD’s outfall as a potential source for the observed shoreline contamination and hypothesized that this wastewater could be impacting the shoreline as the result of oceanographic processes such as internal waves, entrainment by the thermal discharge from the AES Corporation power plant, or a combination of both (i.e., the “UCI Hypothesis”). In the summer of 2001, an extensive coastal ocean measurement program was undertaken to determine if a significant amount of bacteria from the outfall was transported to the adjacent shoreline. This project was the Huntington Beach Shoreline Contamination Investigation, Phase III (HB PIII) of the Orange County Sanitation District’s investigation of possible sources of the bacteria found on Huntington Beach. This report is a summary of the results of the Phase III investigations.
1.2. Orange County Sanitation District (OCSD) Operations
OCSD is the third largest southern California publicly owned treatment works (POTW). They continuously discharge treated wastewater from an ocean outfall located approximately 7 km offshore from Huntington Beach (Figure 1-2). At the time of this study the average daily discharge was almost 1x10⁹ L/day (234 MGD) of wastewater that represented an approximately 50:50 blend of advanced primary- and secondary-treated effluent to attain a minimum of 75% reduction in suspended solids concentrations (Figure 1-3).
The outfall design incorporates a 1-mile-long, 500-port diffuser located near mooring station HB12 (Figure 1-2) at a depth of 60 m in a typically stratified coastal environment. This diffuser allows for significant initial dilution of the wastewater plume as the effluent enters the coastal ocean. The minimum initial dilution of 180:1 (the ratio of ocean water to discharged wastewater) contained in OCSD’s National Pollution Discharge Elimination System (NPDES) ocean discharge permit was based on modeling done by the California State Water Resources Control Board. Other near-field modeling by Stolzenbach and Hendricks (1997), MEC and Jones (2001), and TetraTech (2002) have demonstrated much higher initial dilutions (Figure 1-4).
1.3. Discharge Processes and Effluent Characteristics
1.3.1. Ocean Discharge Processes
Wastewater discharged through the diffuser ports form a “plume” that disperses in the receiving water environment and becomes progressively diluted with time and distance from the outfall. The rates of both the near-field or initial dilution and subsequent far-field reductions in effluent plume constituent concentrations have important permit compliance, environmental, and human health implications. Physical processes that affect mixing and dispersion of the plume are described briefly in this section. The information concerning the general design and function of the ocean outfall provides background information for the evaluations of impacts to receiving water quality.
Plume dispersion can be modeled as a two-step process: (1) “near-field” mixing, in which the buoyant plume rises and mixes with ambient seawater until it reaches its equilibrium density or rises to the sea surface; and (2) “far-field” dispersion by ambient currents with passive diffusion due to ambient turbulence (Figure 1-5). The buoyancy phase lasts on the order of minutes, while the passive dispersion phase lasts up to several days (Wu et al., 1994).
Effluent is discharged as a jet from each of the diffuser ports, with initial momentum due to hydrostatic pressure. The individual jets merge as a plume above the diffuser and rise due to buoyancy caused by the density difference between the effluent and ambient seawater. Regions above the diffuser, in which plume motions transition from a jet to a buoyant plume, are proportional to the momentum flux and buoyancy flux. During plume rise, effluent continues to mix with ambient seawater, diluting the plume constituents and increasing effluent density until it reaches equilibrium with ambient water or the sea surface. After reaching the surface or equilibrium density layer, the plume spreads horizontally, and further mixing with ambient seawater ceases above the bottom of the plume. When overlying waters are stratified because of changes with depth in density properties, the plume rises to the bottom of the pycnocline. The structure of buoyant plumes is dependent on ambient density stratification and current fields (Washburn et al., 1999).
Initial dilution refers to dilution from mixing between the plume and ambient seawater that occurs until the plume loses its initial momentum and reaches a density in equilibrium with the surrounding water. Dilution is defined as the reciprocal of the volume concentration, and is a function of location and time. From an engineering perspective, the design variables of primary importance in determining initial dilution are the overall length of the diffuser and depth of the discharge. The number of diffuser ports and port spacing are of secondary importance (Koh, 1983). OCSD’s diffuser was designed to achieve an initial dilution of 148:1, although recent assessments based on hourly current velocity, receiving water temperature, and effluent flow data during June 15, 1999, through June 24, 2001, indicated an average flux-averaged dilution of 341:1 with an average depth of maximum plume concentration (i.e., minimum dilution) of 36 m below the sea surface (Table 1-3, Figure 1-6) (TetraTech, 2002).
The three primary factors affecting dispersion of the plume are density stratification, local current field, and turbulence levels. Far-field dispersion transports the plume, distorts the plume shape, and promotes additional dilution due to small-scale turbulent mixing, shear dispersion, and horizontal mixing. Plume width increases while thickness decreases due to gravitational collapse (Washburn et al., 1999).
As initial plume momentum dissipates, effluent particles with densities greater than seawater sink, which contributes to separation of dissolved and particulate phases of the plume. The behavior and fate of the particulate fraction is important because the major fraction of metals, bacteria, and organic constituents are associated with small effluent particles (discussed below). Effluent particles sink at varying speeds and distances from the outfall, depending on their size, density, and depth-dependent velocities of horizontal and vertical currents. The median settling velocity of particulate matter in sewage is about 10-3 cm/sec, although rates vary widely (Csanady, 1983). Measurements of OCSD’s effluent showed that approximately 10% of particles sank at a rate of 10-3 cm/sec, whereas the majority of particles appeared to be neutrally buoyant in seawater (SAIC et al., 2001).
The fundamental processes affecting the fate of effluent particles are settling, coagulation, and ingestion by organisms (Morel and Schiff, 1983). Settling of wastewater particles is related primarily to particle size and density, although this is a complex process due in part to the heterogeneity of final effluent, which may vary daily as well as seasonally (Baker et al., 1995), and the complex dynamic formation and dissolution of particle aggregations following discharge to the ocean. The importance of coagulation is related to particle density and turbulence of receiving waters. Generally, the effects of coagulation are minimal for wastewater with low particle concentrations because this reduces the probability of particle-to-particle contact. Consequently, settling rates typically are lower for more dilute particle concentrations. Conversely, higher turbulence levels increase the probability of particle interactions, and thus increase particle settling rates. Particle coagulation, biological consumption and repackaging, and aggregation with fine particles in the “flocculent” layer at the sediment-water interface are important processes that accelerate settling rates above those estimated from settling of individual particles alone (Stolzenbach et al., 1992).
1.3.2. Effluent Characteristics
Municipal wastewater is not homogenous but consists of a mixture of aqueous and particulate components with particles being complex mixtures of organic and inorganic solids. The complex composition of the discharged effluent affects the behavior, and ultimate fate and impact, once it enters receiving waters. Information concerning the size distributions, settling behavior, and contaminant concentrations of effluent particles has important implications for understanding the impacts of effluent discharges on receiving waters and predicting future impacts associated with changes in the effluent composition. SAIC et al. (2001) characterized the physical and chemical composition of OCSD’s final effluent and the size distribution and settling behavior in seawater of effluent particles. These findings are summarized below.
Final effluent is considerably warmer and fresher than ambient receiving waters. Temperatures ranged from 23.1-27.1°C with an average of 25.1°C, while salinity averaged 2.25 psu and ranged from 1.21 to 2.59 psu. Total suspended solids (particle dry weight retained on a 0.45 micron filter) in the final whole effluent averaged 74.4 mg/L (Table 1-4). Mean and median particle sizes in whole effluent averaged 0.0276 mm (27.6 microns) and 0.0168 mm (16.8 microns), respectively (Table 1-5), with a majority (85-90%) of the total TSS concentration represented by the three smallest particle size classes. Particle settling experiments showed that 2.8% of the particles settled to the bottom of the settling chamber within the first hour, 4.2% settled within six hours, 6.1% settled within 12 hours, and 7.9% settled within 24 hours. The cumulative particle recovery after 96 hours represented 12% of the initial particle mass. Bacteria were almost exclusively associated with the smallest effluent particles. Whole effluent samples contained an average of 2x10⁷ MPN/100 mL total coliform bacteria, 9.7x10⁶ MPN/100 mL fecal coliform bacteria, and 2.7x10⁵ MPN/100 mL enterococci bacteria. However, for most effluent constituents, the predicted changes to receiving waters associated with this discharge after initial dilution are relatively small (Table 1-6).
1.4. Huntington Beach Phase III (HB PIII) Hypotheses
The UCI Hypothesis and discussions about other potential cross-shelf transport mechanisms raised several important ocean process and transport questions which OCSD did not have sufficient data to address. The overall problem statement was that bacteria concentrations have periodically exceeded recreational water AB411 bacteria standards compliance limits and resulted in summertime beach closures or postings. The objectives for HB PIII were to (1) characterize the physical oceanographic processes involved in possible cross-shelf transport of the offshore wastewater plume to the vicinity of the AES Corporation thermal discharge outfall or other nearshore locations off Huntington Beach; (2) determine the potential for a causal link between bacteria in the offshore wastewater discharge and beach postings or closures; and (3) if possible, determine if the conditions during the summer of 2001 were similar to those of 1999 and other years with unusual surfzone bacteria levels.
OCSD, along with U.S. Geological Survey (USGS), Naval Postgraduate School (NPS), Scripps Institution of Oceanography (SIO), the University of Southern California (USC), Science Applications International Corporation (SAIC), and MEC Analytical Systems, Incorporated (MEC), developed and carried out a large-scale hydrographic and physical oceanographic study in the spring and summer of 2001, known as the Huntington Beach Shoreline Contamination Investigation, Phase III (HB PIII). As part of the study design phase, a Technical Advisory Committee (TAC) was established by OCSD to provide input from a wide range of groups, including other government agencies and non-government organizations, such as local environmental groups and private citizens. From these TAC meetings a series of hypotheses were developed for the study to test (Table 1-7).
To support the hypothesis posed by Grant et al. (2000), there would have to be a process or processes that meet the following conditions 1 and 2, as well as either 3 or 4: (1) rapid cross-shelf transport of the plume; (2) dilution and die-off rates of bacteria that are sufficiently low to prevent adequate dissipation of these indicators of the plume; (3) entrainment of the plume without significant dilution in the power plant thermal discharge; or (4) a mechanism for the direct transport of wastewater plume through the surfzone to the beach. Results from previous and ongoing OCSD monitoring have shown the following: (1) currents predominantly flow parallel to isobaths (that is, either upcoast or downcoast); (2) there is some cross-shelf transport of the plume, but it has never been seen to impact the beach; (3) the wastewater plume is submerged from late spring through fall because it is trapped below the seasonal thermocline during these stratified periods; and (4) the extensive studies conducted during the summer of 1999 did not indicate any relationship between OCSD’s discharge and surfzone bacteria seen at Huntington Beach.
Regarding Hypotheses B and C (Table 1-7), the TAC believed that these mechanisms are less likely to cause surfzone water-quality impairment than the mechanisms described in Hypothesis A. Therefore, it was not recommended that the study be designed explicitly to test these hypotheses. However, some data collected for testing Hypothesis A may be analyzed to provide limited testing of Hypotheses B and C.
1.5. Huntington Beach Phase III (HB PIII) Program Elements
The HB PIII study consisted of several integrated and complementary program elements that collected both temporal and spatial data to evaluate cross-shelf transport processes, including currents, wind, barotropic and baroclinic tides, internal waves, and upwelling. The study components included:
1) Current speed and direction, temperature, and conductivity measurements at multiple, fixed moorings;
2) Water sampling using hydrographic profiling and discrete measurements of specific water-quality parameters used to identify the wastewater plume;
3) Standard daily sampling and analysis of bacterial levels in the surfzone collected five days per week by OCSD and additional hourly sampling of surfzone bacteria during six hydrographic cruises conducted during spring tides; and
4) Near-field plume modeling.
In addition, historical and other concurrent data were used to evaluate any potential correlations between beach contamination events and concurrent meteorological and oceanographic conditions.
A description of the exact sites in the moored array, the hydrographic profiling program, and the bacterial sampling is given in Chapter 2. This section of the report also describes the methods used to process the data collected in this large, multidisciplinary program.
Baker, E.K., P.T. Harris, B. Kensett-Smith, D.F. Bagster, and D.M. Nobbs. 1995. Physical properties of sewage particles in seawater. Marine Pollution Bulletin v. 34, p. 247-252.
Csanady, G.T. 1983. Advection, diffusion, and particle settling. Chapter 5, in E.P. Myers and E.T. Harding (eds.), Disposal of municipal wastewater: Impacts on the coastal environment. MIT Sea Grant College Program III. MIT Technical Reports MITSG 83-33.
Grant, S., C. Webb, B. Sanders, A. Boehm, J. Kim, J. Redman, A. Chu, R. Morse, S. Jiang, N. Gardiner, and A. Brown. 2000. Huntington Beach Water Quality Investigation Phase II: An analysis of ocean surfzone, watershed, sediment and groundwater data collected from June 1998 through September 2000. Prepared for National Water Research Institute, County of Orange, Cities of Huntington Beach, Fountain Valley, Costa Mesa, Santa Ana, Newport Beach and Orange County Sanitation District.
Koh, R.C.Y. 1983. Delivery systems and initial dilution. Chapter 4, in E.P. Myers and E.T. Harding (eds.), Disposal of municipal wastewater: Impacts on the coastal environment. MIT Sea Grant College Program III. MIT Technical Reports MITSG 83-33.
MEC Analytical Systems, Inc., and B.H. Jones. 2001. Special study plume tracking, August 1999-September 2000. Prepared for the Orange County Sanitation District, Fountain Valley, California. Vols. 1-3.
Morel, F.M.M and S.L. Schiff. 1983. Geochemistry of municipal waste in coastal waters. Chapter 6, in E.P. Myers and E.T. Harding (eds.), Disposal of municipal wastewater: Impacts on the coastal environment. MIT Sea Grant College Program III. MIT Technical Reports MITSG 83-33.
Science Applications International Corporation (SAIC), MEC Analytical Systems, Inc., and CRG Marine Laboratories, Inc. 2001. Strategic process study: Final effluent characterization, Phase I. Prepared for Orange County Sanitation District (OCSD), Fountain Valley, California.
Stolzenbach, K.D., K.A. Newman, and C.S. Wong. 1992. Aggregation of fine particles at the sediment-water interface. Journal of Geophysical Research, v. 97, p. 17,889-17,898.
Stolzenbach, K. and T. Hendricks. 1997. Analysis of effluent plume transport. Report prepared for the Orange County Sanitation District. OCSD, Fountain Valley, California. 9 pp + Appendices.
TetraTech. 2002. Nearfield and farfield modeling of an ocean outfall wastewater discharge. Final Report prepared for the Orange County Sanitation District (OCSD), Fountain Valley, California, November 1, 2002. 50 p.
Washburn, L., S. Stone, and S. MacIntyre. 1999. Dispersion of produced water in a coastal environment and its biological implications. Continental Shelf Research, v. 19, p. 57-78.
Wu, Y., L. Washburn, and B.H. Jones. 1994. Buoyant plume dispersion in a coastal environment: evolving plume structure and dynamics. Continental Shelf Research, v. 14, p. 1001-1023.
U.S. Department of the Interior, U.S. Geological Survey, Western Region Coastal and Marine Geology
URL of this page: http://pubs.usgs.gov/of/2004/1019/chap1.html
Maintained by: Mike Diggles
Created: September 10, 2004
Last modified: October 13, 2004 (md)