
CHAPTER 8. SEDIMENT RESUSPENSION AND TRANSPORT NEAR THE OCSD OUTFALL
Home
Chapter 1. Introduction and Background
Chapter 3. Surfzone Bacteria Patterns
Chapter 4. Subtidal Circulation Pathways
Chapter 5. Newport Canyon Transport Pathway
Chapter 7. Tidal Transport Pathways
Chapter 8. Sediment Resuspension and Transport near the OCSD Outfall
Chapter 9. Nearshore Circulation and Transport Pathways
One of the hypotheses in the Huntington Beach Phase III study is that sediment transport could be a mechanism that brings outfall bacteria to the beach. When bottom shear stress due to surface waves, internal waves, shelf currents, or the combination of these forces exceeds a critical value, which is mainly determined by the grain size, the bed sediment, as well as particle-bound bacteria, could be resuspended into the water column. Cross-shelf transport mechanisms (Chapters 5, 6, and 7) could then bring the suspended particles to the shore. It is not clear how bacteria are partitioned between water-borne and particle-bound after being discharged from the OCSD outfall diffuser. We assume that a certain percentage of discharged bacteria are absorbed to sediment particles and then deposited on the sea floor in the vicinity of the outfall diffuser. In this chapter, we explore the possibility of sediment resuspension in the vicinity of the OCSD outfall by calculating the bed shear stress from the measured data of surface waves and near-bed currents.
8.2. Surface waves and near-bed currents
Surface waves and winds were measured from a meteorological buoy at HB07 (Chapter 2). Hourly wind speed, wave period, and significant wave heights are plotted in Figure 8-1. It shows a typical southern California summer condition with calm wave climate and daily sea breeze weather pattern. During the four-month long deployment, significant wave height rarely reached 1.0 m, and the vast majority was between 0.6 and 0.7 m. The surface waves fall into two distinct groups, in terms of wave period and wave direction (Figure 8-2). The majority are short-period waves (5-10 seconds) that are mainly from the west, exhibit a daily cycle, and are presumably generated by the daily westerly sea breeze. There is a high correlation between the diurnal oscillation in the wind speed and wave height (Figure 8-1), and between the directions of wind and these short-period waves (Figure 8-3). The second wave group is the long-period (14-18 seconds) swells from the south. These swells are generally created by distant storms that can be as far as 8000 km away (Xu and Noble, 2003). Typically these swells are less energetic than the locally generated wind waves (Figure 8-2).
The near-bed current was measured with an Acoustic Doppler Velocimeter (ADV) located 60 cm above the sea floor. To obtain a record of low-frequency currents (not due to waves), an hourly-averaged record was generated by averaging 2048 data points sampled at 2 Hz (Figure 8-4). The hourly current showed magnitudes ranging from 0 to 19 cm/s, but mostly between 2 and 10 cm/s. In 70-m water depth (HB07) this current was unlikely to be wind-driven; this is evidenced by the higher frequency variability of the current as compared with the wind (Figures 8-4 and 8-5). In the spectral domain, while the diurnal band dominates the wind energy due to the daily breeze, the near-bed current was predominantly semidiurnal. This semidiurnal tidal current in the bottom boundary layer was stronger in the cross-shelf direction, in contrast to the mainly along-isobath subtidal current in the bottom boundary layer at this site (Figure 8-6).
The hourly data of wave heights, wave periods and near-bed current velocities described in the previous section were used to calculate bed shear stresses, tcw, using a simple quadratic equation (Nielsen, 1992):
![]()
![]()
where tcw is bed shear stress due to combined waves and currents, r (=1027 kg/m3) is the sea-water density and u*cw is the combined shear velocity:
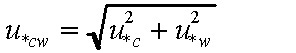
where u*c and u*w are shear stresses due to currents and waves, respectively. The shear velocities can be estimated using quadratic formula:
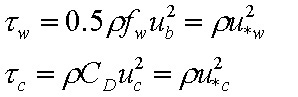
therefore
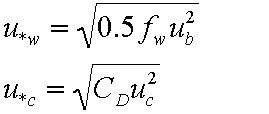
ub is the near-bed orbital velocity that is calculated from the heights and periods of the surface waves. uc is the hourly mean current measured at 60 cm above the bed. fw is friction factor associated with waves, and can be calculated using an explicit formula (Swart, 1974):
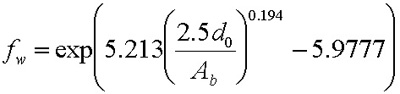
where d0 is the median grain size at HB07 (100 micron), and Ab is the near-bed orbital semi-excursion. The current friction factor, CD,, is estimated using an iterative routine described in (Grant and Madsen, 1979).
8.4. Sediment resuspension near OCSD outfall
The estimated bed shear stress (Figure 8-7) intermittently surpassed the critical shear stress of 0.5 dyne/cm2 (Gardner, 1989) and caused resuspension of the fine material (very fine sand and silt) from the bed. Some estimated shear stresses were even occasionally higher than a more conservative critical value of 1.0 dyne/cm2 reported in the literature (Maa et al., 1993). These resuspension events, and therefore the validity of the estimated values of bed shear stress, are also confirmed by both the water clarity data and video footage. In the first video footage during June 25-26, 2001, the concentration of suspended particles was clearly higher than in the video footage from previous days, although most features on the bottom were not eroded. In the video footage during July 26-27, 2001, the particle concentration grew higher and there was obvious erosion of the bedforms.
Figure 8-7 shows no apparent correlation between resuspension and beach contamination events, although a few beach contamination events do coincide with or immediately follow periods of high shear stress (e.g., beach events on July 19-22, July 5-8, August 10-11, August 28-30, September 4, September 15-17, and October 4-6). Whether the resuspended sediments can be brought to the nearshore and then on to the beach depends on the sediment properties (e.g., settling velocity), changes in sediment-bacteria associations, and shelf circulation patterns that are controlled by oceanographic processes described in other sections of this report. If bacteria are mixed into the sub-thermocline layer, the resulting transport problem is similar to that of whether the sub-thermocline wastewater plume waters can be transported onshore quickly enough (e.g., by internal waves).
Bed shear stress was also estimated at a site (HBN2) in 10 m of water depth (Figure 8-8). The current speed was from the first bin of an ADCP measurement at this site. There was no wave measurement at HBN2; therefore the wave height and period from the HB07 site were used. Based on linear wave theory (e.g., Dean and Dalrymple, 1991), long-period swells have slightly higher wave height in 10 m of water depth than in 60 m water depth, while short-period wind-waves have slightly lower wave height in 10 m than in 60 m of water depth. For a deep-water swell of 14-second period and 0.6-m height (Figure 8-1), its wave height in 10 m of water depth is ~10% greater than in 60 m of water depth. For a deep-water wave of 7-second period and 1.0-m height, its wave height in 10 m water depth is ~8% less than in 60 m water depth. Figure 8-8 clearly shows that the bed shear stress in the 10-m site was almost consistently greater than 1.0 dyne/cm2 (the heavy dotted horizontal line)–the upper limit of critical value for fine material. Even the 80% of the estimated value (the lighter dotted line), which adequately accounts for the lower wave height at the 10-m site for short-period wind waves, is much greater than the critical shear stress. This indicates that fine material (silt and fine sand) are mostly in suspension in 10 m of water depth. If particle-bound bacteria are on these fine particles by preference, due to their higher absorbing power, the bacteria themselves will also be in suspension most of the time.
Sediment resuspension was occasionally observed near the OCSD outfall during the four-month deployment, mainly in high wind-wave events. These resuspension events, however, were not correlated with beach bacteria contamination. In 10 m of water depth, fine sediments were almost consistently in suspension due to high bed shear stress. Therefore, even the particle-bound bacteria should also be mostly in suspension.
Dean, R.G. and R.A. Dalrymple, 1991. Water wave mechanics for engineers and scientists. World Scientific Publishing, Singapore, 353 p.
Gardner, W.D., 1989. Periodic resuspension in Baltimore Canyon by focusing of internal waves. Journal of Geophysical Research, v. 94, p. 18185-18194
Maa, J.P.-Y., L.D. Wright, C.-H. Lee, and T.W. Shannon, 1993. VIMS sea carousel: a field instrument for studying sediment transport. Marine Geology, v. 115, p. 271-287.
Grant, W.D. and O.S. Madsen, 1979. Combined wave and current interaction with a rough bottom. Journal of Geophysical Research, v. 84, p. 1797-1808.
Nielsen, P., 1992. Coastal bottom boundary layers and sediment transport. World Scientific Publishing, Singapore, 324 p.
Swart, D.H., 1974. Offshore sediment transport and equilibrium beach profiles. Delft Hydraulics Laboratory Publication, No. 131.
Xu, J.P. and M.A. Noble, 2003. Tracking storm origins from RDI ADCP measurements. 50th EPOC conference, Catalina Island, CA, September 24-27, 2003.
U.S. Department of the Interior, U.S. Geological Survey, Western Region Coastal and Marine Geology
URL of this page: http://pubs.usgs.gov/of/2004/1019/chap8.html
Maintained by: Mike Diggles
Created: September 24, 2004
Last modified: October 06, 2004 (lh)