In order to develop a database for a park-wide assessment of coastal change-potential, data for each of the six variables mentioned above were gathered from state and federal agencies (table 2). The database is based on the one used by Thieler and Hammar-Klose (1999) and loosely follows an earlier database developed by Gornitz and White (1992). A comparable assessment of the sensitivity of the Canadian coast to sea-level rise is presented by Shaw and others (1998).
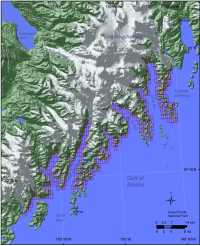
The database was constructed using a 1:63,360-scale shoreline of Kenai Fjords NP that was created from USGS 1:63,360 quadrangles (1950-1990) and obtained from the National Park Service, Alaska Support Office, GIS Data Clearinghouse [http://www.nps.gov/akso/gis/]. Data for each of the six variables (geomorphology, shoreline change, coastal slope, relative sea-level change, significant wave height, and tidal range) were added to the shoreline attribute table using a 1-minute (approximately 1.5 km) grid (fig. 5). Next, each variable in each grid cell was assigned a change-potential value from 1-5 (1 is very low change-potential, 5 is very high change-potential) based on the potential magnitude of its contribution to physical changes on the coast in response to sea level changes (table 1).