Discussion
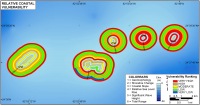 |
| Figure 5. Relative Coastal Vulnerability for Dry Tortugas National Park. Click on figure for larger image. |
The data within the coastal vulnerability index (CVI) show variability at different spatial scales (Figure 5). However, the ranked values for the physical process variables vary less over the extent of the shoreline. The value of the relative sea-level rise variable is constant at low vulnerability for the entire study area. The significant wave height vulnerability is low to very low. The tidal range is very high vulnerability (< 1m) for all of Dry Tortugas.
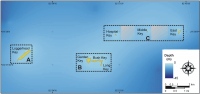 |
| Figure 4. Index map for historic shoreline change figures. Click on figure for larger image. |
The geologic variables show the most spatial variability and thus have the most influence on CVI variability (Figure 5). Geomorphology in the park includes high vulnerability beachrock stabilized shoreline and very high vulnerability carbonate beach including areas with manmade structures. Vulnerability assessment based on historical shoreline change trends varies from low to very high (Figure 4 A -E). Regional coastal slope is in the high vulnerability range over the entire extent of Dry Tortugas.
The area within the Dry Tortugas that may be most vulnerable to future sea-level rise (very high vulnerability) are the islands with the highest rates of shoreline change and high wave heights such as Middle key and East Key. The areas least vulnerable to sea-level rise may be the south facing shorelines of Bush and Long Key due to shoreline accretion and low wave energy.
The most influential variables in the CVI are geomorphology, historical shoreline change rates, and significant wave height; therefore they may be considered the dominant factors controlling how Dry Tortugas will evolve as sea level rises. Geomorphology and significant wave height only vary between high and very high and low and very low vulnerability, respectively; whereas the shoreline change variable ranges from low to very high.
Back to Top