|
Methods
A SeaBeam Instruments 2112 Multibeam Echo Sounder (12 kHz) was used to acquire the new bathymetric data on the NOAA Ship Ronald H. Brown. This system utilizes up to 151 electronically aimed beams spaced at intervals of 2 degrees that insonify a swath of sea floor up to 3 times the water depth. Over the continental rise, in water depths greater than about 2,000 m, a 5-km track separation was employed, which provided almost 100% overlap of the insonified area from swath to swath. Time considerations compelled less ideal coverage of the continental slope area, where a track-line separation of about 1.7 km was used, that provided nearly no data overlap between swaths. The survey was conducted at approximately 10 knots (18.5 km/hr). The horizontal resolution of the beam on the sea floor ranged from about 20-65 m in the across-track direction and about 10 m in the along-track direction at 500 m water depth, and from about 100-400 m across-track and 40 m along-track at 3,000 m water depth. Vertical resolution is approximately 1% or better of the water depth. The bathymetric data are presented at a resolution of 100 m/pixel. The values are an average of the soundings within an inner 75 m circle, and a weighted average of the soundings within an outer circle that increased in size with water depth: between 500 and 1,500 m, the outer circle radius was 100 m, between 1,500 and 2,500, the radius was 200 m, and for depths greater than 2,500 m, the radius was 300 m.
Software (MB System) developed at Lamont-Doherty Earth Observatory of Columbia University was used to process and edit the bathymetric and navigation data. Software (Swath-Ed) developed by the Ocean Mapping Group at the University of New Brunswick was used to create the grids and images.
The shaded-relief image (Sheet 1) was created by vertically exaggerating the topography three times and then artificially illuminating the relief by a light source positioned 45 degrees above the horizon from an azimuth of 315 degrees. To improve the dynamic range of the image, the 8-bit illumination values between 100 and 210 were stretched between 0 and 255, values below 100 were set to 0, and values above 210 were set to 255. In the resulting image, topographic features appear enhanced by strong illumination on the northwest-facing slopes and by shadows cast on southeast-facing slopes. The image also accentuates small features that could not be shown effectively by contours alone at this scale. An alternate shaded-relief image, created by exaggerating the bathymetry ten times and then artificially illuminating the relief by a light source positioned 30 degrees above the horizon from an azimuth of 45 degrees (fig. 3), reduces the appearance of bathymetric artifacts in the along-track direction, and enhances bathymetric features that trend northwest-southeast.
Backscatter intensity (Sheet 2) is a measure of surficial sediment texture and bottom roughness. Generally, high backscatter intensity is associated with rock or coarse-grained sediment and low-backscatter intensity characterizes finer-grained sediments. However, direct observations, using bottom photography or video and sampling techniques such as grab sampling or coring, are needed to verify such interpretations. To improve the dynamic range of the backscatter image, the 8-bit backscatter values below 180 were set to zero, values between 180 and 225 were stretched between 0 and 255, and values above 225 were set to 255. In the image shown on Sheet 2, the stretched backscatter intensity is represented by a suite of eight colors ranging from blue, which represents low intensity, to red, which represents high intensity. These data are draped over the shaded-relief image. The resulting image displays light and dark tones within each color band that result from a feature's position with respect to the light source. For example, northwest-facing slopes, receiving strong illumination, show as a light tone within a color band, whereas southeast-facing slopes, being in shadow, show as a dark tone within a color band. An alternate backscatter-intensity image is shown on figure 4. Here the backscatter is presented alone as a gray scale rather than being combined with the shaded-relief image as on Sheet 2.
On both sheets, sea floor topography from the NGDC Coastal Relief Model (National Geophysical Data Center, 1998) is shown on the continental shelf and on the continental slope to the southwest and northeast of the multibeam data (fig. 2). These data are a compilation of historical bathymetric data gridded at a resolution of 90 m/pixel. The individual points and striping in the historical bathymetry that appear inconsistent with adjacent multibeam values (particularly noticeable on the slope in the northeast part of Sheet 1 and Sheet 2 between 70° and 72° W and north of 39° 40' N) reflect data from different sources obtained at different times with different techniques and accuracies. Data from a multibeam survey of the Hudson Shelf Valley (Butman and others, 2003) covers the head of Hudson Canyon with a resolution of 30 m/pixel and extends northwestward onto the shelf in a 20-km-wide strip. Data from a prior multibeam survey of the Hudson Canyon, collected aboard the R/V Atlantis by investigators at WHOI, cover the section of Hudson Canyon from the canyon head to 3,500 m water depth on the continental rise, but these data are shown here only between the southeastward limit of the Hudson Shelf Valley survey and the northwestern limit of the NOAA Ship Ronald H. Brown survey (fig. 2). Resolution of these data is 100 m/pixel. Data from a portion of a multibeam survey of the outer shelf carried out as part of the STRATAFORM project (Goff and others, 1999) occupies a triangle on the western edge of the study area, beginning near 39° 19' N, 72° 22' W. Resolution of these data is 20 m/pixel. The boundary between multibeam data and the historical NGDC data is marked by the sharp transition to increased small-scale resolution in the area of multibeam data.
Shaded-relief topography colored by backscatter intensity (Sheet 2) is displayed only for the multibeam data collected with the SeaBeam system aboard the NOAA Ship Ronald H. Brown (colored area). Shaded-relief topography, based on the NGDC Coastal Relief Model and the other multibeam data, without coloring for backscatter intensity, is shown by the gray tones in the area surrounding the NOAA Ship Ronald H. Brown survey area.
Smoothed bathymetric contours were created using ARC/INFO geographic information system software (Environmental Systems Research Institute, Inc., version 8.2). Smoothing of the multibeam bathymetric data over 500 m and the NGDC Coastal Relief Model bathymetric data over 450 m was accomplished using a rectangular 5 cell by 5 cell focal median filter. Bathymetric contours at 80 and 100 m and at 200 m intervals in depths ranging from 200 m to 3,800 m were generated from the grids using the "contour" routine in the ARC/GRID component of ARC/INFO. The contours are displayed here unedited. The contours generated from the NGDC data and the contours generated from the multibeam data do not exactly match at the boundaries of the data sets. The slope of the sea floor was computed from the smoothed bathymetric grid using Spatial Analyst in ArcGIS (fig. 5).
A streamflow network was computed using the ESRI Arc Hydro Tools (version 1.1) (fig. 6). Networks that drain areas larger than 10 square km (1,000 pixels) are shown. Along-track depressions several meters deep at the outer edge of the survey tracks, caused by errors in the sound velocity, sometimes capture the streamflow in areas of flat topography, resulting in unrealistic northeast-southwest straight runs in the streamflow path. This is particularly noticeable in the southeastern portion of the survey area between 3000 and 3800 m water depth. Further editing of the multibeam data might reduce these patterns. Many of the unnatural NE-SW drainage paths were visually identified and are shown in figure 6 at reduced color intensity.
Some features in the multibeam data (Sheet 1 and Sheet 2) are artifacts of data collection and environmental conditions. They include unnatural-looking features and patterns oriented parallel or perpendicular to survey track lines. On both sheets, the orientation of the track lines is identified by parallel stripes oriented northeast-southwest. Much of the striped appearance is eliminated in the shaded-relief image illuminated from the northeast, parallel to the ship track (fig. 3). In the backscatter-intensity image (Sheet 2; fig. 4) track lines appear as parallel lines of noisy backscatter intensity (blue and red on Sheet 2); this striping directly below the ship is particularly noticeable on the upper continental rise to the northeast and southwest of Hudson Canyon. High backscatter intensity along the floor of Hudson Canyon, particularly up-canyon, northwest, of about 39° N, appears to be interrupted by this striping. A mismatch in the time constant of the SeaBeam motion sensor and ship autopilot, as well as some problems with the data-acquisition software, resulted in the appearance of corrugations perpendicular to the ship track. These are visible principally in the shaded-relief image (Sheet 1) in smooth areas of the upper rise (for example, this is particularly prominent south of 38°40' N, 71°20' W). Data collected during some of the turns of the ship at the end of the survey line were retained to maximize data coverage; these results in semicircular patterns with corrugations along the northeast and southwest edges of the survey (see for example the turn centered near 39°11' N, 70°57' W). The anomalous area of low-backscatter intensity (dark blue on Sheet 2 and black on fig. 4) in the southern part of the survey (centered near 38°5' N, 71°09' W) and the swath to the northeast of this area centered near 38°28' N, 70°26' W are caused by low-backscatter returns due to rough seas. Light brown areas are areas of no data.
 To view files in PDF format, download free copy of Adobe Acrobat Reader. To view files in PDF format, download free copy of Adobe Acrobat Reader. |
Click on the following figures for larger images in PDF format.
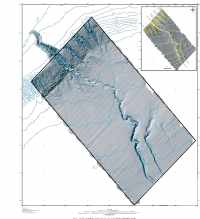
Map Sheet 1 -- Map only. Sea floor topography as shaded relief.
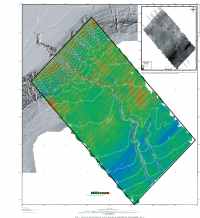
Map Sheet 2 -- Map only. Sea floor topography as shaded relief with backscatter intensity superimposed in color.
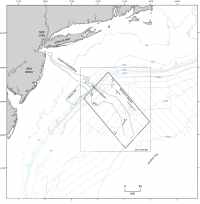
Figure 2. Map showing the location of the Hudson Canyon on the continental slope.
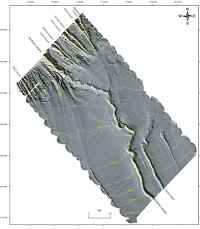
Figure 3. Map showing shaded-relief image of the sea floor.
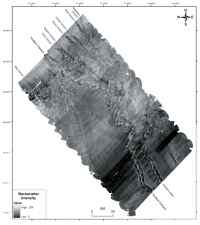
Figure 4. Map showing the backscatter intensity derived from the multibeam data.
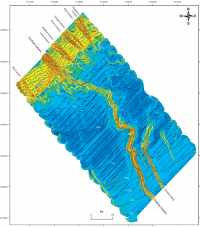
Figure 5. Map showing slope of the sea floor.
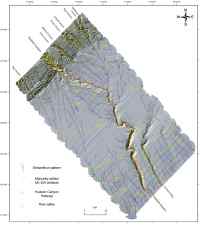
Figure 6. Map showing streamflow drainage for areas draining at least 1,000 pixels
|