Physical Process Variables
The relative sea-level change variable is derived from the change in annual mean water elevation over time as measured at tide gauge stations along the coast. The rate of sea-level rise for Pago Pago on Tutuila is 1.48 +/- 0.56 mm/yr based on 52 years of data (Zervas, 2001). This variable inherently includes both eustatic sea-level rise as well as regional sea-level rise due to isostatic and tectonic adjustments of the land surface. Relative sea-level change data are a historical record, and thus portray only the recent sea-level trend (<150 years). Relative sea-level rise for National Park of American Samoa falls within the very low vulnerability category based on water elevation data in Pago Pago (Figure 10).
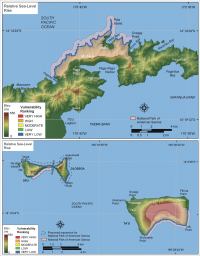 |
| Figure 10. Vulnerability ranking for the rate of relative sea-level rise for the National Park of American Samoa. Click on figure for larger image. |
|
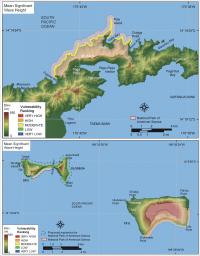 |
Figure 11. Vulnerability ranking for mean significant wave heights for the National Park of American Samoa based on World Wave Atlas data. Click on figure for larger image.
|
|
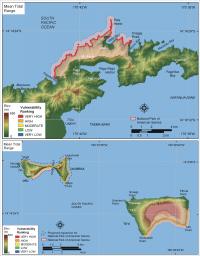 |
| Figure 12. Vulnerability ranking for mean tidal range in the National Park of American Samoa. Click on figure for larger image. |
|
Mean significant wave height is used here as a proxy for wave energy which drives coastal sediment transport. Wave energy is directly related to the square of wave height:
E = 1/8 ρgH2
where E is energy density, H is wave height, ρ is water density and
g is acceleration due to gravity. Thus, the ability to mobilize and transport coastal sediments is a function of wave height squared. In this report, we use modeled mean significant wave height data from Oceanor's World Wave Atlas (http://www.oceanor.no/products/software/wwa/). Significant wave heights along south and east facing coasts (high vulnerability) are slightly higher than along north-facing shorelines (moderate vulnerability). Where fringing coral reefs are present significant wave heights are considered low vulnerability (Figure 11).
Tidal ranges linked to both permanent and episodic inundation hazards. Tide range data were obtained from a NOAA/NOS published benchmark in Pago Pago Harbor, where the mean tidal range is 0.765 m (very high vulnerability), and from a NOAA Nautical Chart for the Manu'a Islands, where mean tidal range is 1.128 m (high vulnerability) (Figure 12).
.
 [an error occurred while processing this directive]