USGS Open-File Report 2005-1231
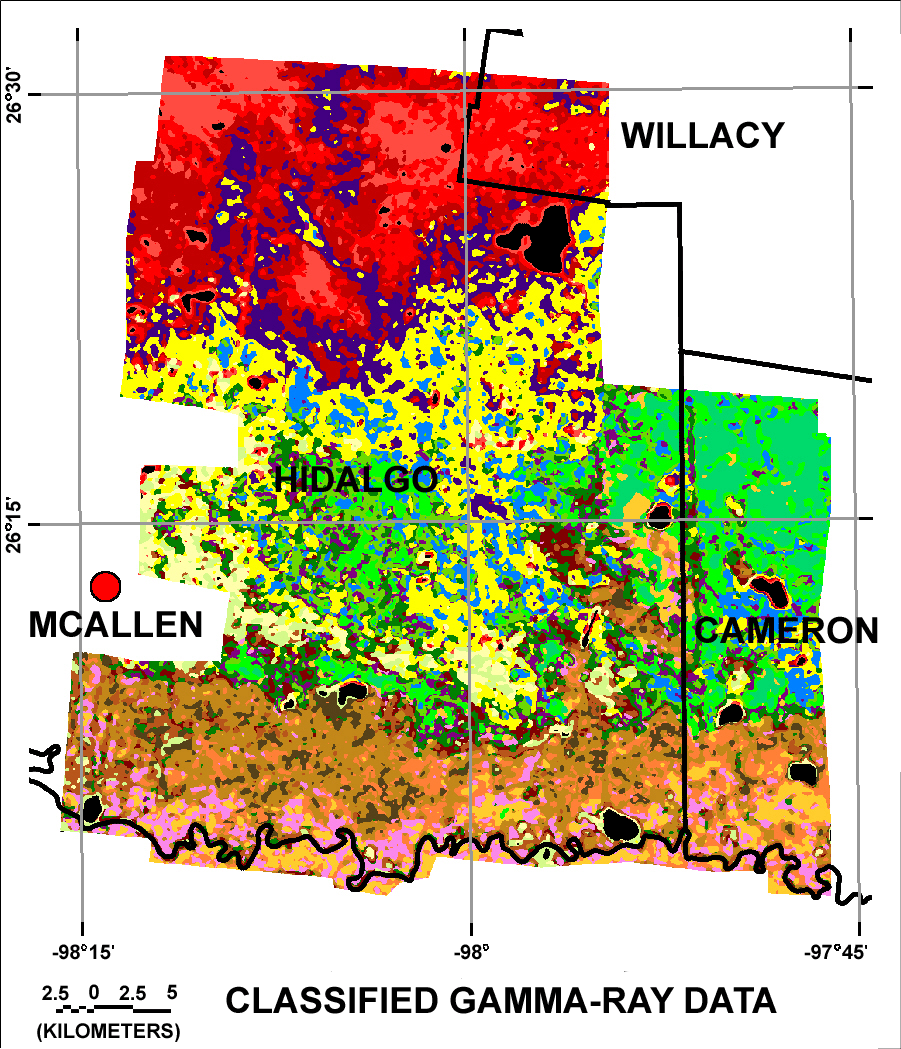
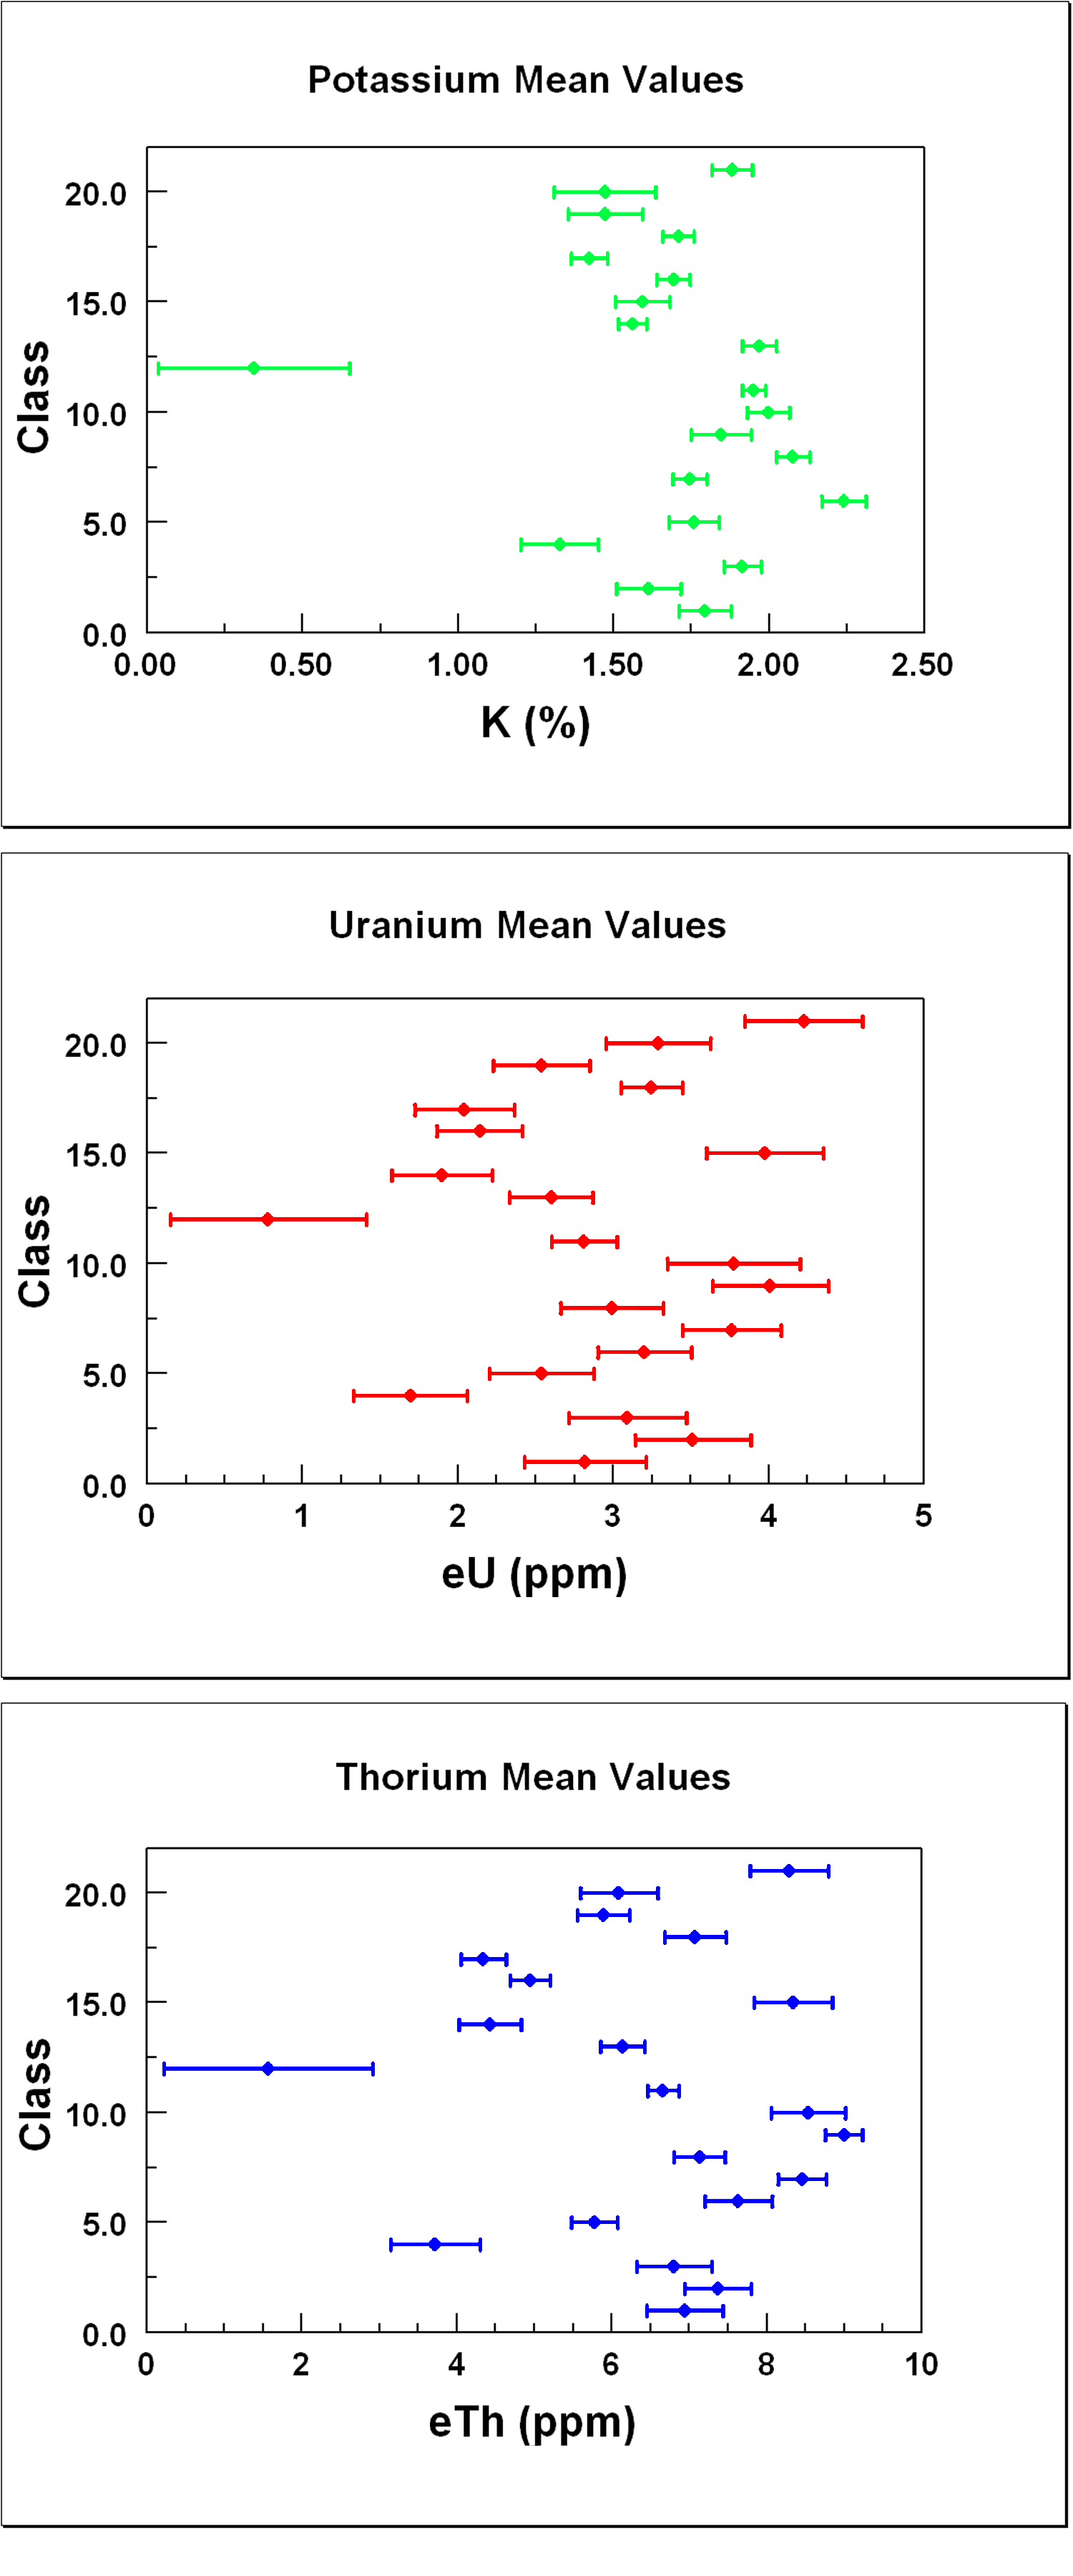
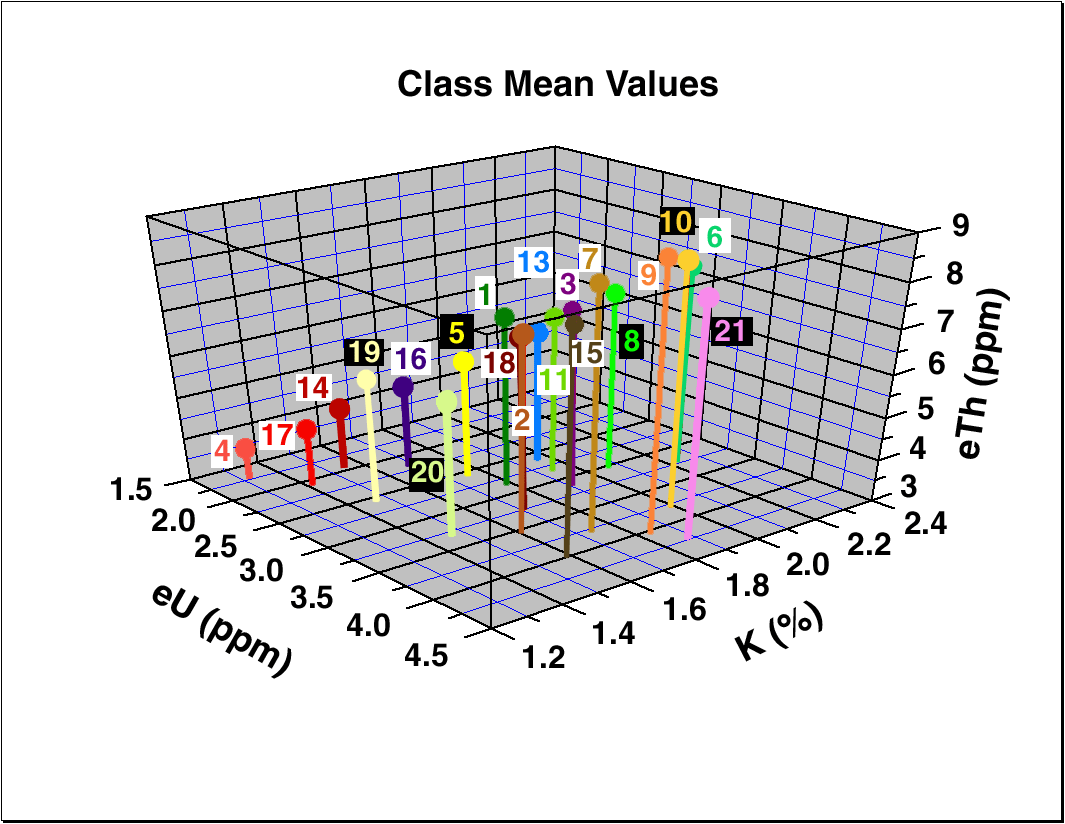
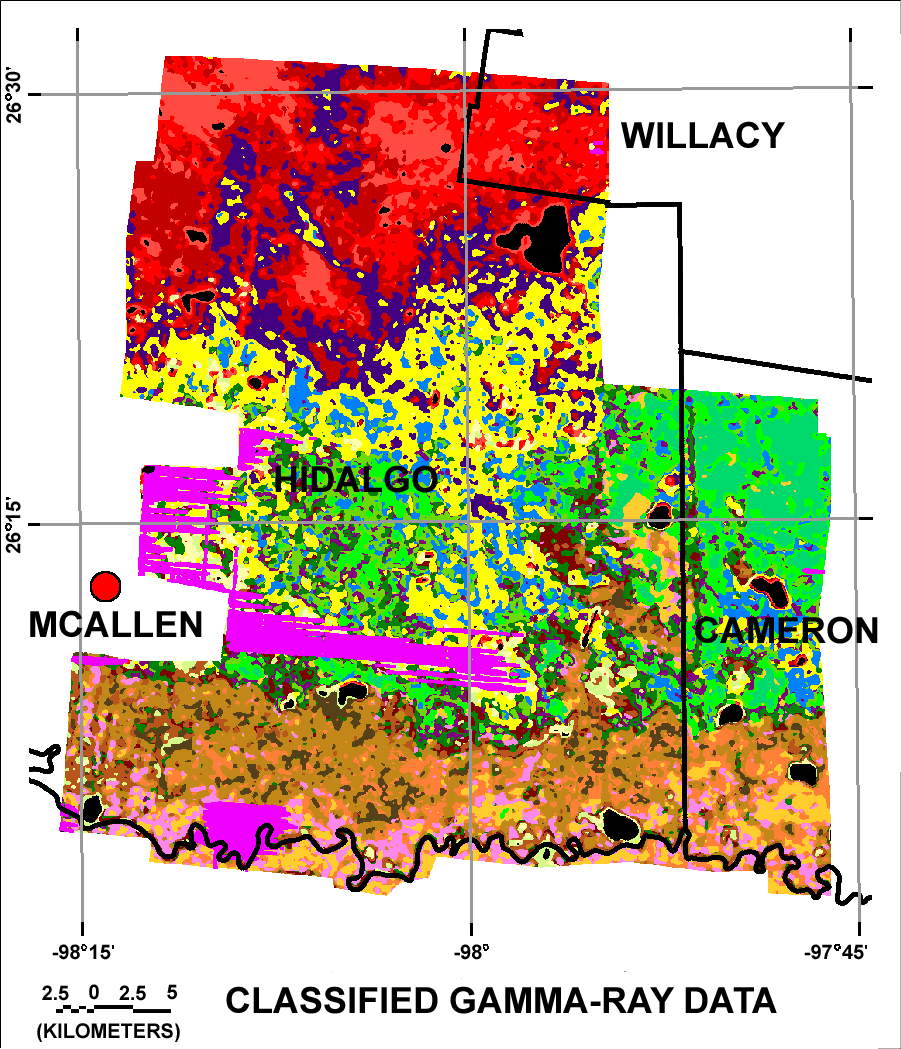
The gamma-ray data were classified with a supervised maximum likelihood classifier. Prior to classification the data were normalized to produce distributions with a mean value of zero and a standard deviation of one. Areas used for the initial classification were selected based upon color patterns in the composite-color map. The maximum likelihood classifier produced grids of classification rules for each of the selected color patterns. Those classification rules were used to refine the areas used to calculate the class signatures by identifying grid cells most likely to belong to a particular class. The revised class signatures were then used to classify the data. Twenty-one classes were defined and the Figure G1 shows the result of the classification. Click on the map to view a larger image and click here to open the color legend in a separate window. Table G1 lists the mean and standard deviation values of potassium, uranium, and thorium for each of the twenty-one classes. Figure G2 is a plot of the mean values and standard deviations of potassium, uranium, and thorium for all of the classes. Figure G3 shows the mean values plotted in a three-dimensional representation. Figure G4 shows a version of the classification map with areas where the survey aircraft flew at effective altitudes greater than 200 m. Those higher altitudes are cause for concern because the data in those locations are less reliable and the classification results should be considered questionable.

Figure G1. Map showing the classes determined by maximum likelihood classification of the gamma-ray data.
Table G1. Table of class mean values and standard deviations of the grids of potassium, uranium, and thorium.
|
Class No. |
Potassium (%K) |
Uranium (ppm eU) |
Thorium (ppm eTh) |
|||
|
Mean |
Std. Dev. |
Mean |
Std. Dev. |
Mean |
Std. Dev. | |
|
1 |
1.79 |
0.08 |
2.8 |
0.4 |
6.9 |
0.5 |
|
2 |
1.61 |
0.10 |
3.5 |
0.4 |
7.4 |
0.4 |
|
3 |
1.91 |
0.06 |
3.1 |
0.4 |
6.8 |
0.5 |
|
4 |
1.33 |
0.12 |
1.7 |
0.4 |
3.7 |
0.6 |
|
5 |
1.76 |
0.08 |
2.5 |
0.3 |
5.8 |
0.3 |
|
6 |
2.24 |
0.07 |
3.2 |
0.3 |
7.6 |
0.4 |
|
7 |
1.74 |
0.05 |
3.8 |
0.3 |
8.5 |
0.3 |
|
8 |
2.08 |
0.05 |
3.0 |
0.3 |
7.1 |
0.3 |
|
9 |
1.84 |
0.10 |
4.0 |
0.4 |
9.0 |
0.2 |
|
10 |
2.00 |
0.07 |
3.8 |
0.4 |
8.5 |
0.5 |
|
11 |
1.95 |
0.04 |
2.8 |
0.2 |
6.7 |
0.2 |
|
12 |
0.34 |
0.31 |
0.8 |
0.6 |
1.6 |
1.4 |
|
13 |
1.97 |
0.06 |
2.6 |
0.3 |
6.1 |
0.3 |
|
14 |
1.56 |
0.04 |
1.9 |
0.3 |
4.4 |
0.4 |
|
15 |
1.59 |
0.09 |
4.0 |
0.4 |
8.3 |
0.5 |
|
16 |
1.69 |
0.05 |
2.1 |
0.3 |
4.9 |
0.3 |
|
17 |
1.42 |
0.06 |
2.0 |
0.3 |
4.3 |
0.3 |
|
18 |
1.71 |
0.05 |
3.2 |
0.2 |
7.1 |
0.4 |
|
19 |
1.47 |
0.12 |
2.5 |
0.3 |
5.9 |
0.3 |
|
20 |
1.47 |
0.16 |
3.3 |
0.3 |
6.1 |
0.5 |
|
21 |
1.88 |
0.06 |
4.2 |
0.4 |
8.3 |
0.5 |
[Figure G2] [Figure G3] [Figure G4] [Top]

Figure G2. Graph showing the mean values of potassium, uranium, and thorium for the classes plotted using the symbols shown in the legend. The standard deviations are indicated by the horizontal lines.
[Table G1] [Figure G3] [Figure G4] [Top]

Figure G3. Three dimensional plot of the mean values of potassium, uranium, and thorium for the classes. The means for class 12 are not included in order to improve the visual presentation. The symbols and labels for each class are colored according to the colors of the classification map.
[Table G1] [Figure G2] [Figure G4] [Top]

Figure G4. Classification map with areas where the survey aircraft flew at effective altitudes greater than 200 m indicated by bright magenta.
[Table G1] [Figure G2] [Figure G3] [Top]
![]() Aerial Gamma-ray Data | Geology Comparisons
Aerial Gamma-ray Data | Geology Comparisons ![]()