USGS Open-File Report 2005-1231
Classes that appear related to the presence of water are R02, R12, R18, R19, and R20. Figure W1 shows the histograms for potassium. Figure W2 shows the histograms for uranium and Figure W3 shows the histograms for thorium. In all cases the concentrations of potassium, uranium, and thorium for class R12 are less than the concentrations of the other classes in this group.
For class R02, the potassium distribution largely overlaps the distributions of classes R18, R19, and R20 but does not overlap that of R12. The uranium distribution of R02 overlaps those of classes R18 and R20, has little overlap with the uranium distribution of class R19, and has no overlap with that of class R12. An examination of the classification map and the geologic map indicates that class R02 occurs almost exclusively in areas mapped as recent floodplain deposits (Qas and Qam). Grid cells classified as R02 also often occur around areas classified as R12.
For class R12, the potassium , uranium, and thorium distributions exhibit little overlap with the corresponding distributions of the other classes in this group. A comparison of the classification map with the locations of ponds and lakes clearly shows that class R12 is a robust indicator of the presence of water. A close examination of the classification map also shows that the other classes in this group often occur around areas classified as R12.
For class R18, the potassium distribution overlaps that of class R02, does not overlap that of R12, and exhibits some overlap with classes R19 and R20. The uranium distribution of R18 overlaps the uranium distributions of classes R02 and R20, does not overlap that of R12, and shows some overlap with R19. For class R18, the thorium distribution overlaps that of class R02, does not overlap that of R12, and exhibits some overlap with classes R19 and R20. An examination of the classification map and the geologic map shows that class R18 occurs almost exclusively in areas mapped as recent floodplain deposits (Qas and Qam).
For class R19, the potassium distribution overlaps the potassium distributions of classes R02 and R20, does not overlap that of R12, and exhibits some overlap with class R19. The uranium distribution of R19 exhibits some overlap with the uranium distributions of all of the other classes in this group. The thorium distribution of R19 overlaps that of class R20 but has relatively little overlap with the thorium distributions of classes R02, R12, and R18. Comparison of the classification map and the geologic map shows that class R19 occurs mostly in areas mapped as members of the Beaumont Formation (Qb, Qbf, Qbm). Examination of the map showing areas where the survey aircraft flew at effective altitudes greater than 200 m reveals that many of the grid cells classified as class R19 occur in those areas.
For class R20, the potassium distribution overlaps the potassium distributions of classes R02 and R19, has little overlap with that of R12, and exhibits some overlap with class R18. The uranium distribution of R20 overlaps the uranium distributions of classes R02 and R18, does not overlap that of R12, and shows some overlap with R19. The thorium distribution of R20 overlaps that of class R19, has relatively little overlap with the thorium distribution of class R12, and exhibits some overlap with R18 and R02. Comparison of the classification map and the geologic map shows that class R20 occurs mostly in areas mapped as members of the Beaumont Formation (Qb, Qbf, Qbm). Examination of the map showing areas where the survey aircraft flew at effective altitudes greater than 200 m reveals that many of the grid cells classified as class R20 occur in those areas.
One conclusion that can be drawn from these comparisons is that class R12 is very distinct and the geographical correlation with the locations of known bodies of water indicates that class R12 is a robust indicator of water. The fact that the other classes often occur around areas of R12 is probably an indication that those particular grid cells include the influence of the water of the water on the measurements. Detailed examinations of relatively large areas classified as class R12 show that the classes included in this comparison are not uniquely associated with R12 and that many of the other classes sometimes occur around areas of R12. Figure W4 shows an example where an area of R12 is surrounded by grid cells that are classified as many different classes. This result suggests that any occurrence of a variety of apparently unrelated classes may be an indication of the presence of water or possibly of soils with higher water contents.
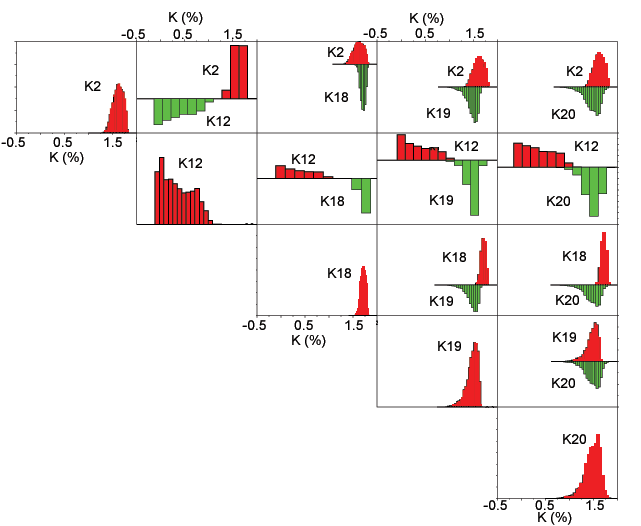
Figure W1. Matrix of potassium bi-histograms for classes related to water. The number denotes the class (refer to the classification map).
[Figure W1] [Figure W2] [Figure W3] [Figure W4]
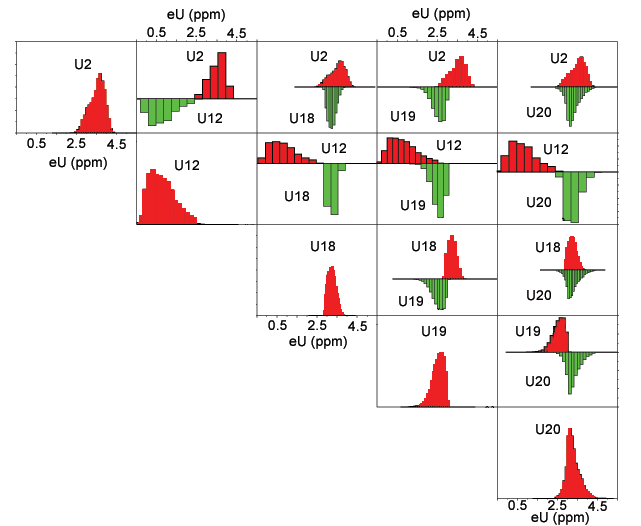
Figure W2. Matrix of uranium bi-histograms for classes related to water. The number denotes the class (refer to the classification map).
[Figure W1] [Figure W2] [Figure W3] [Figure W4]
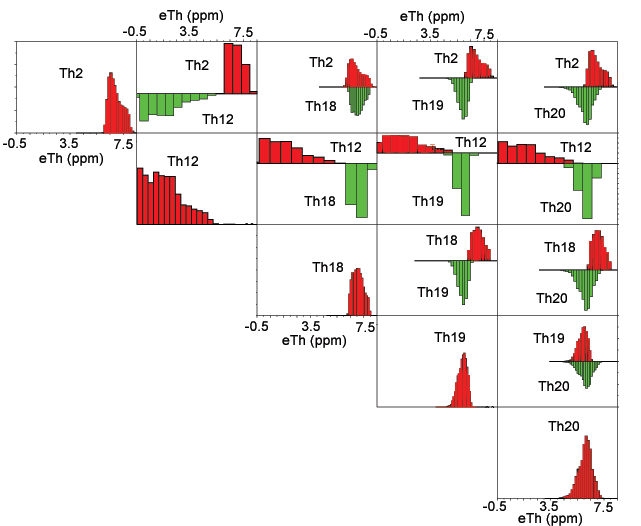
Figure W3. Matrix of thorium bi-histograms for classes related to water. The number denotes the class (refer to the classification map).
[Figure W1] [Figure W2] [Figure W3] [Figure W4]
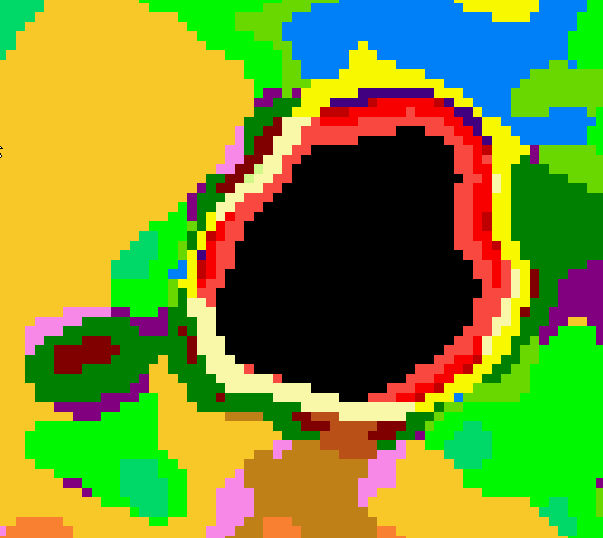
Figure W4. Detailed area showing an area of class R12 surrounded by grid cells assigned to a variety of different classes.
[Figure W1] [Figure W2] [Figure W3] [Figure W4]

![]() U.S. Department of the Interior |
U.S. Geological Survey
U.S. Department of the Interior |
U.S. Geological Survey
URL: http://pubsdata.usgs.gov/pubs/of/2005/1231/watergrp.htm
Page Contact Information: Stephen Snyder
Page Last Modified: Saturday, 12-Jan-2013 21:28:36 EST