Physical Process Variables
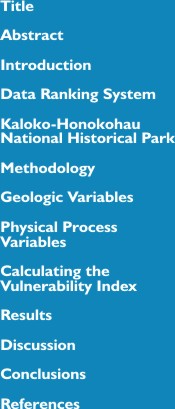
The relative sea-level change variable is derived from the change in annual mean water elevation over time as measured at tide gauge stations along the coast. The rate of sea-level rise for Kaloko-Honokohau is 3.36 +/- 0.21 mm/yr based on 73 years of data at Hilo, Hawaii (table 2) (Zervas, 2001). This variable inherently includes both eustatic sea-level rise as well as regional sea-level rise due to isostatic and tectonic adjustments of the land surface. Relative sea-level change data are a historical record, and thus portray only the recent sea-level trend (< 150 years). Relative sea-level rise for the big island of Hawaii falls in the very high vulnerability category based on water elevation data at Hilo (fig. 7).
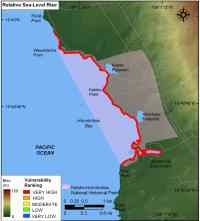
Mean significant wave height is used here as a proxy for wave energy which drives coastal sediment transport. Wave energy is directly related to wave height
E = 1/8 ρgH2
where E is energy density, H is wave height, ρ is water density and
g is acceleration due to gravity. Thus, the ability to mobilize and transport coastal sediments is a function of wave height squared. In this report, we use historical mean significant wave height data for the period 1984-2001 obtained from the National Data Buoy Center (table 2) (NDBC). Buoy station 51002 located 215 nautical miles south-southwest of Hilo, HI was used for the mean significant wave heights for Kaloko-Honokohau. The Atlas of Natural Hazards in the Hawaiian Coastal Zone (Fletcher and others, 2002) was also used to verify wave heights within the park. The open coast is at high vulnerability with respect to wave heights, however, inside Honokohau Harbor mean significant wave height is low to very low vulnerability (fig. 8).
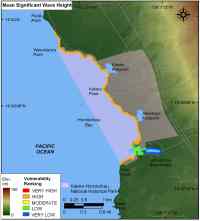
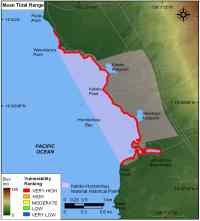
Tidal range is linked to both permanent and episodic inundation hazards. Tide range data were obtained from a NOAA/NOS published benchmark in Kawaihae, Hawaii and from a USGS Circulation study within the park (table 2) (Storlazzi and Presto, 2005). Mean tidal range here is 0.446 m; therefore Kaloko-Honokohau National Historical Park is classified as very high vulnerability (< 1meter) with respect to tidal range (fig. 9).