|
|
|
|
|
| Report Home | Maps | Overview | Mapping Methods | Coastal Classifications | Geologic Setting | Coastal Processes | Coastal Vulnerability | Classification Summary | References | |||||||||||||||||||||||||||||||
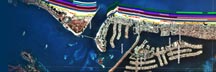
Classification SummaryThe coastal classification maps provide a basis for establishing the lengths of shore that have a particular morphological characteristic or urban attribute. Such information is relevant for local and state governments for planning that involves the amount of shore that is developed versus undeveloped, or the amount of parkland held in the public trust. Also, there is interest regarding the amount of shore that is affected by engineering structures, referred to as armoring or hardening of the shore. Environmental-protection and resource-management issues such as these require quantitative data that can be derived from the classification maps. The shore lengths and equivalent percents of the 242.6-km-long segment of coast between Sabine Pass and the Colorado River are presented for each classification unit in Table 2. Seventy-four percent of this coastal segment is undeveloped and where it is developed, such as on Bolivar Peninsula, Galveston Island, and near Freeport, the development is mostly low to moderate density. High-density development is restricted to Galveston Island. Single-family homes are much more common than multi-family units, such as high-rise condominiums and hotels, and 7% of the shore is classified as parks. Dunes are not well developed along most of this shore and continuous or discontinuous dunes are only present on 35% and 7% of the shore, respectively. An overwash terrace is present along 51% of the shore and zones of complete storm overwash represent about 2% of the shore. The overwash zones are located along the Brazos River delta and in the Cedar Lakes area. Low artificial dunes have been constructed on Galveston Island that in its natural erosional state would have been classified as overwash terrace. Fifty-four percent of the shore is characterized by narrow beaches less than 30 m wide. Because the beaches are commonly used for recreation, about 40% of the shore is regularly maintained by some type of beach raking or scraping. About 21% of the shore is influenced by hard structures. Most of the structures are walls, riprap revetments, or geotubes built in the backbeach area. The engineering structures are concentrated in the developed areas, with the most structures concentrated on Galveston Island where the massive seawall, groins, and riprap line the shore. The most recent attempts to stabilize the shore with structures have involved placement of geotubes on Bolivar Peninsula, Galveston Island, and the north end of Follets Island (Fig. 10).
|