Open-File Report 2005-1413
The aerial gamma-ray surveys in Alaska were flown under contract to the U.S. Department of Energy as part of the National Uranium Resource Evaluation (NURE) Program. The surveys were flown during the summer months of 1975, 1976, 1977, 1979, and 1980. The figure below shows the index map of the aerial surveys by contractor and year flown.
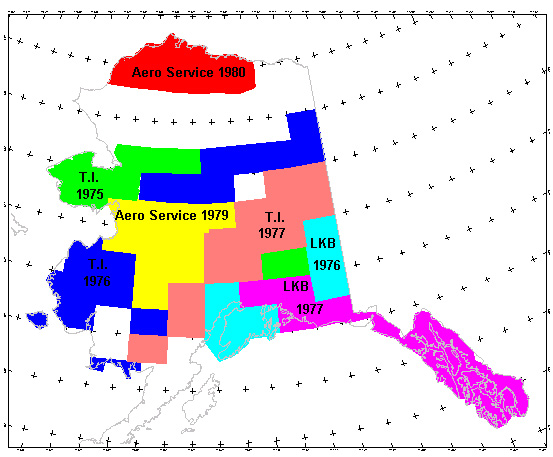
Aero Service refers to Aero Service, Inc., T.I. to Texas Instruments, Inc., and LKB to LKB Resources, Inc. You can click on parts of the index map to view the references for the surveys. The surveys were flown with east-west flightlines spaced at about 10 km and north-south tie-lines spaced at about 40 km. The nominal survey altitudes were 122 m above the ground with a detector volume of about 50 L of thallium doped sodium iodide detectors. The data were corrected by the contractors for aircraft and cosmic background, altitude variations, Compton scattering, and airborne bismuth-214. Some of the gamma-ray systems were calibrated such that the data were provided by the contractors as apparent surface concentrations of potassium, uranium, and thorium. For the other surveys, the data were provided as counts per second. The data were processed by the U.S. Geological Survey (USGS) to convert the count rates to concentration units. This was done by comparing the data to calibrated surveys and assuming that the conversion only requires multiplication by a scaling factor. For large areas of Alaska, the count rates are very low and the data were often zero or negative. Zero and negative values were arbitrarily set to a small value close to zero. Because the count rates decrease at an exponential rate as the altitude increases, data for altitudes greater than about 250 m above the ground were set to a dummy value and were not used in the gridding process. The data in Alaska were previously published by Duval (2001).
The database named EasternUS.gdb contains the flightline data for the gamma-ray surveys along the eastern seaboard of the USA. Figure 1 is an index map showing the area covered by the flightlines in the database. Table 1 lists the data channels contained in the database. Click here to access index maps that provide references for specific surveys. Click here to view an index map showing flightline spacing of surveys in the conterminous USA.
Figure 1. Index map showing the area covered by the flightlines in the EasternUS.gdb database.
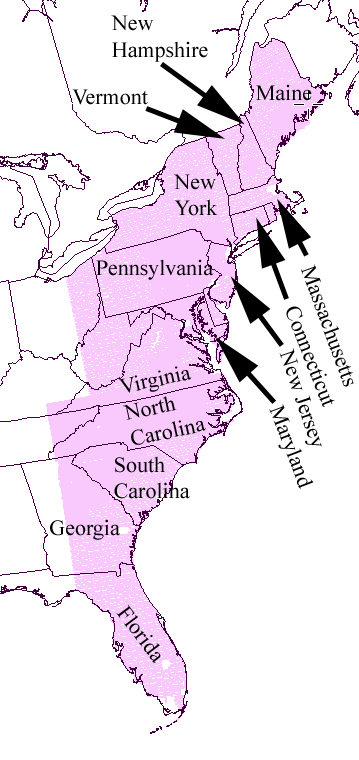
Table 1. Listing of data channels in the EasternUS.gdb database.
|
Channel Name |
Description |
|
Lat |
Latitude of the data points in decimal degrees of north latitude. |
|
Long |
Longitude of the data points in decimal degrees of west longitude (given as negative numbers). |
|
X |
Projected x-coordinate of the data points (meters) |
|
Y |
Projected y-coordinate of the data points (meters) |
|
K |
Potassium concentration (percent K) |
|
eU |
Uranium concentration (ppm eU) |
|
eTh |
Thorium concentration (ppm eTh) |
|
Alt |
Radar altimeter (meters) |
|
Mag |
Residual magnetic field (nanoTeslas) |
The database named EastCentUS.gdb contains the flightline data for the gamma-ray surveys in the east central part of the USA. Figure 1 is an index map showing the area covered by the flightlines in the database. Table 1 lists the data channels contained in the database. Click here to access index maps that provide references for specific surveys. Click here to view an index map showing flightline spacing of surveys in the conterminous USA.
Figure 1. Index map showing the area covered by the flightlines in the EastCentUS.gdb database.
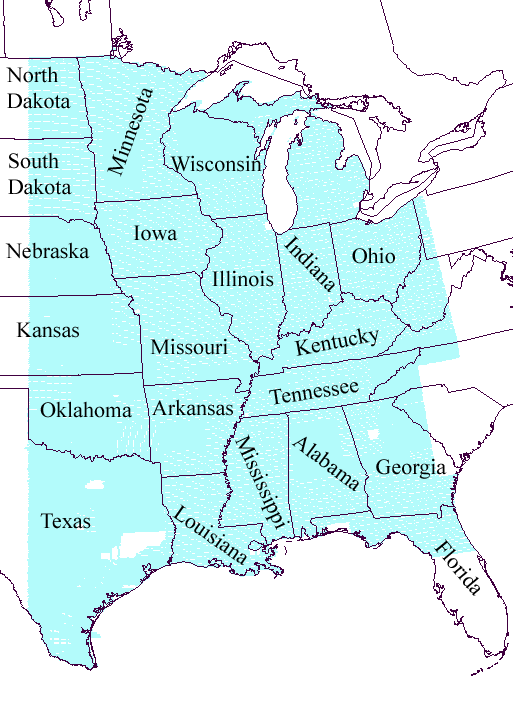
Table 1. Listing of data channels in the EastCentUS.gdb database.
|
Channel Name |
Description |
|
Lat |
Latitude of the data points in decimal degrees of north latitude. |
|
Long |
Longitude of the data points in decimal degrees of west longitude (given as negative numbers). |
|
X |
Projected x-coordinate of the data points (meters) |
|
Y |
Projected y-coordinate of the data points (meters) |
|
K |
Potassium concentration (percent K) |
|
eU |
Uranium concentration (ppm eU) |
|
eTh |
Thorium concentration (ppm eTh) |
|
Alt |
Radar altimeter (meters) |
|
Mag |
Residual magnetic field (nanoTeslas) |
The database named WestCentUS.gdb contains the flightline data for the gamma-ray surveys in the west central part of the USA. Figure 1 is an index map showing the area covered by the flightlines in the database. Table 1 lists the data channels contained in the database. Click here to access index maps that provide references for specific surveys. Click here to view an index map showing flightline spacing of surveys in the conterminous USA.
Figure 1. Index map showing the area covered by the flightlines in the WestCentUS.gdb database.
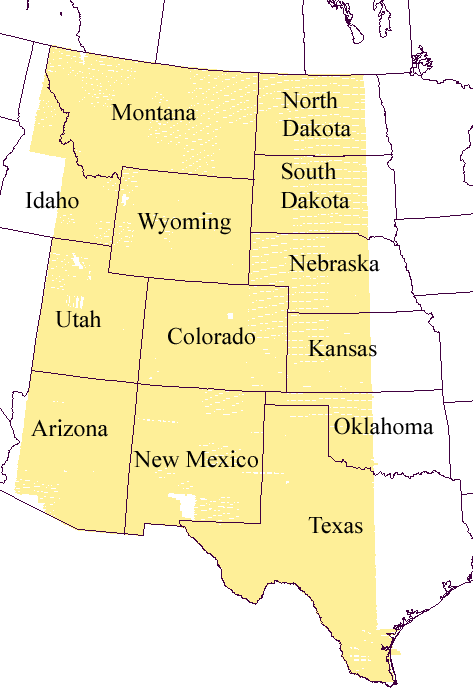
Table 1. Listing of data channels in the WestCentUS.gdb database.
|
Channel Name |
Description |
|
Lat |
Latitude of the data points in decimal degrees of north latitude. |
|
Long |
Longitude of the data points in decimal degrees of west longitude (given as negative numbers). |
|
X |
Projected x-coordinate of the data points (meters) |
|
Y |
Projected y-coordinate of the data points (meters) |
|
K |
Potassium concentration (percent K) |
|
eU |
Uranium concentration (ppm eU) |
|
eTh |
Thorium concentration (ppm eTh) |
|
Alt |
Radar altimeter (meters) |
|
Mag |
Residual magnetic field (nanoTeslas) |
The database named WesternUS.gdb contains the flightline data for the gamma-ray surveys along the western seaboard of the USA. Figure 1 is an index map showing the area covered by the flightlines in the database. Table 1 lists the data channels contained in the database. Click here to access index maps that provide references for specific surveys. Click here to view an index map showing flightline spacing of surveys in the conterminous USA.
Figure 1. Index map showing the area covered by the flightlines in the WesternUS.gdb database.
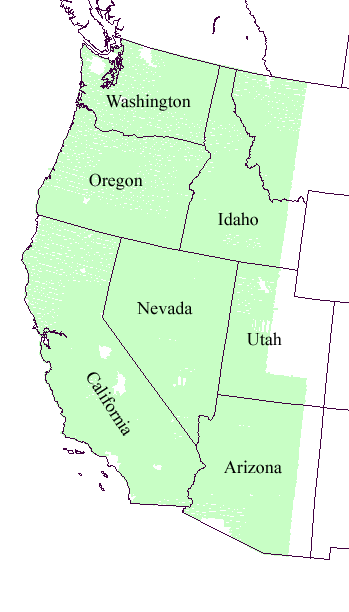
Table 1. Listing of data channels in the WesternUS.gdb database.
|
Channel Name |
Description |
|
Lat |
Latitude of the data points in decimal degrees of north latitude. |
|
Long |
Longitude of the data points in decimal degrees of west longitude (given as negative numbers). |
|
X |
Projected x-coordinate of the data points (meters) |
|
Y |
Projected y-coordinate of the data points (meters) |
|
K |
Potassium concentration (percent K) |
|
eU |
Uranium concentration (ppm eU) |
|
eTh |
Thorium concentration (ppm eTh) |
|
Alt |
Radar altimeter (meters) |
|
Mag |
Residual magnetic field (nanoTeslas) |
Home | Data Files | Data Processing | Flightline Databases | Maps | References | Glossary

![]() U.S. Department of the Interior |
U.S. Geological Survey
U.S. Department of the Interior |
U.S. Geological Survey
URL: http://pubsdata.usgs.gov/pubs/of/2005/1413/flightline.htm
Page Contact Information: USGS Publications Team
Page Last Modified: Saturday, 12-Jan-2013 21:48:56 EST
