| DataSetKey (Browse Graphic) | DataSet (Metadata) | SiteKey(Start) | SampleKey(Start) | SitesOutput | SamplesOutput | WestBounding | EastBounding | NorthBounding | SouthBounding |
| 1 | Hersey, 1967: Deep Sea Photographs | 1 | 1 | 12 | 9 | -75.4 | -66.4 | 42.15 | 29.98 |
| 7 | NOAA: Southeast Monitoring and Assessment (SEAMAP) data | 13 | 10 | 21824 | 8743 | -81.44733 | 33.53333 | 36.5 | 26.93 |
| 8 | U.S. EPA: Environmental Monitoring and Assessment Program (EMAP) data | 21837 | 8753 | 2149 | 3066 | -97.6027 | -69.941 | 42.1917 | 25.9448 |
| 9 | Sommerfield, 2001: GeoCLUTTER CH01_17 Sediment Grain Size Analysis, New Jersey | 23986 | 11819 | 6 | 57 | -72.86792 | -72.7393 | 39.33889 | 39.26698 |
| 10 | Sommerfield, 2003: Upper Delaware Estuary | 23992 | 11876 | 382 | 493 | -75.58207 | 39.4596 | 40.04963 | -75.48917 |
| 11 | Data from Cape Henlopen Cruise, CH01_17, 2001 | 24374 | 12369 | 229 | 264 | -73.12977 | -72.50887 | 39.42331 | 38.99951 |
| 12 | Ardhuin, 2002, coast of Duck, North Carolina | 24603 | 12633 | 239 | 237 | -75.73817 | -74.8375 | 36.5843 | 36.11335 |
| 14 | ONR, Cape Henlopen cruise off Martha's Vineyard, August 2002 | 24842 | 12870 | 36 | 70 | -70.57305 | -70.55346 | 41.344 | 41.31333 |
| 15 | Goff, et al, 2000 (L1400 data) | 24878 | 12940 | 295 | 295 | -73.745 | -72.9467 | 39.6998 | 39.2666 |
| 22 | National Status and Trends Program: Long Island Sound Contaminants | 25173 | 13235 | 122 | 122 | -73.9035 | -72.0765 | 41.353 | 40.76 |
| 23 | NOAA-NMFS, Galveston Laboratory Essential Fish Habitat Project data | 25295 | 13357 | 173 | 173 | -96.764 | -80.788 | 30.005 | 24.351 |
| 27 | NGDC '073' files | 25468 | 13530 | 6758 | 7823 | -180 | 180 | 81.705 | -78.367 |
| 28 | CERCTM54: USACE ICONS Cores, Cape Canaveral, Florida to Georgia | 32226 | 21353 | 20 | 65 | -81.3389 | -80.3498 | 30.52132 | 28.3613 |
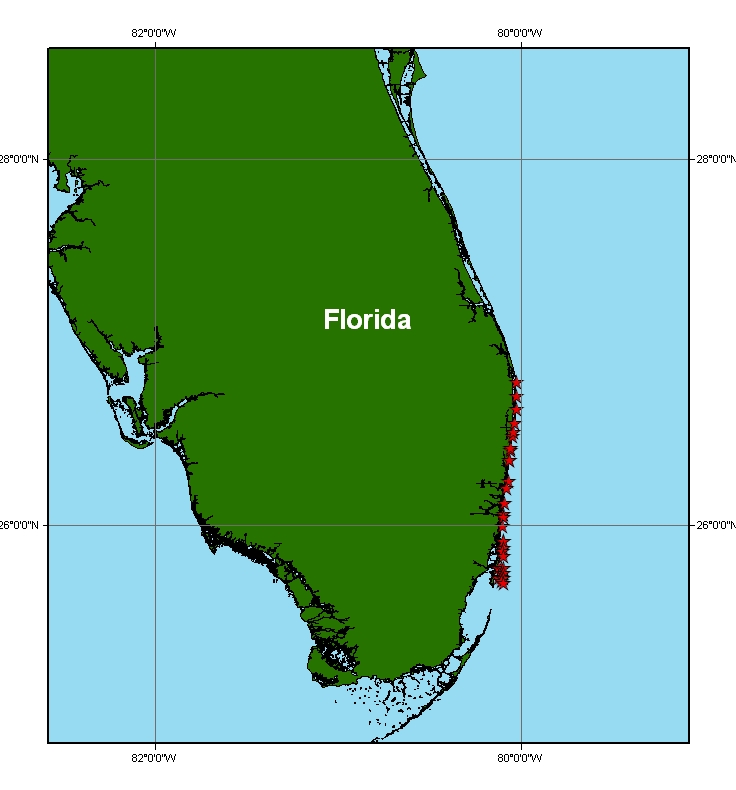
| 29 | CERCTM34: USACE ICONS Cores, Palm Beach to Cape Kennedy, Florida | 32246 | 21418 | 73 | 314 | -80.60068 | -80.09092 | 28.30218 | 27.30223 |
| 30 | CERCTM42: USACE ICONS Cores, Cape Canaveral, Florida | 32319 | 21732 | 13 | 20 | -80.5828 | -80.428 | 28.66197 | 28.09207 |
| 31 | CERCTM29: USACE ICONS Cores, Miami to Palm Beach, Florida | 32332 | 21752 | 31 | 185 | -80.12392 | -80.02321 | 26.78326 | 25.68251 |
| 33 | CERCTM45: USACE ICONS Cores, Inner New York Bight | 32363 | 21937 | 67 | 391 | -74.08417 | -73.5839 | 40.57729 | 40.27374 |
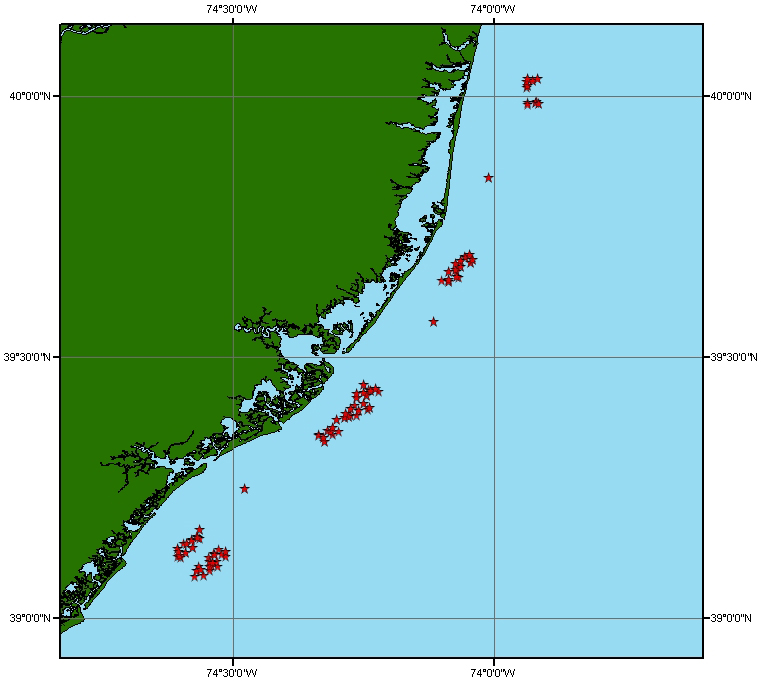
| 34 | CERCMR82-10: USACE ICONS Cores, Central New Jersey | 32430 | 22328 | 68 | 361 | -74.3504 | -73.9789 | 39.82517 | 39.35685 |
| 35 | CERCTP76: USACE ICONS Cores, Long Island South Shore | 32498 | 22689 | 131 | 795 | -73.66063 | -71.845 | 41.16785 | 40.44041 |
| 37 | USACE vibracores: Union Beach, Point Comfort, Sandy Hook, 1998 | 32629 | 23484 | 16 | 114 | -74.1809 | -73.9721 | 40.4806 | 40.4536 |
| 38 | USACE vibracores: Staten Island, 2000 | 32645 | 23598 | 19 | 73 | -74.0999 | -74.0682 | 40.5623 | 40.5289 |
| 39 | USACE New York Bight Mud Dump Site, 1988 | 32664 | 23671 | 14 | 254 | -73.8432 | -73.8385 | 40.3733 | 40.367 |
| 40 | USACE vibracores: Sandy Hook to Manasquan, 1983 - 1989 | 32678 | 23925 | 90 | 568 | -73.9975 | -73.9153 | 40.4402 | 40.1171 |
| 41 | CERCMR80-4: USACE ICONS Cores, Cape May region, New Jersey | 32768 | 24493 | 101 | 294 | -75.0404 | -74.4987 | 39.0001 | 38.7545 |
| 42 | USACE: NY/NJ Harbor | 32869 | 24787 | 189 | 189 | -74.2505 | -73.9685 | 40.60167 | 40.45117 |
| 46-224 | Seafloor Surficial Sediment Descriptions (Deck41) NGDC Data Set G02094 | 33058-46188 | 24976-38106 | 13147 | 13147 | -180.00 | 180.00 | 81.983 | -79.667 |
| 226 | Jones and Schubel, 1980: Distributions of surficial sediment and eelgrass in Great South Bay, New York (from Smith Point, West to Wantagh State Parkway) | 46205 | 38123 | 582 | 582 | -73.51494 | -72.8753 | 40.76797 | 40.60064 |
| 227 | Coch, 1986: Sediment characteristics and facies distributions | 46787 | 38705 | 503 | 503 | -74.24538 | -73.92965 | 40.72627 | 40.4249 |
| 228 | Maryland Geological Survey: Offshore Sand Resources in Northern Maryland Shoal Fields (Conkwright, et al, 2000) | 47290 | 39208 | 37 | 624 | -74.95934 | -74.90204 | 38.48056 | 38.36508 |
| 229 | MMS2000-052, New Jersey vibracores (Byrnes, et al, 2000) | 47327 | 39832 | 149 | 149 | -74.60657 | -73.91528 | 40.03519 | 39.08071 |
| 230 | National Status and Trends Program: Mussel Watch | 47476 | 39981 | 451 | 438 | -158.1242 | -68.73417 | 61.13617 | 21.3025 |
| 231 | National Status and Trends Program: Benthic Surveillance | 47927 | 40419 | 411 | 249 | -166.508 | 118.178 | 70.508 | 25.613 |
| 236 | Smith, 1996 | 48338 | 40668 | 40 | 327 | -74.69661 | -74.52696 | 39.1839 | 38.97621 |
| 237 | NCGS2001-02: Vibracores from offshore Northern Dare County, North Carolina | 48378 | 40995 | 56 | 361 | -75.7213 | -75.26985 | 36.25767 | 35.87297 |
| 238 | OBTF_1999: NCDOT Outer Banks Task Force Offshore Sand Resources Study | 48434 | 41356 | 122 | 1202 | -75.9125 | -75.39616 | 35.79716 | 35.08959 |
| 239 | VASEDS, 1981 | 48556 | 42558 | 2168 | 2161 | -76.49054 | 0 | 37.95667 | 0 |
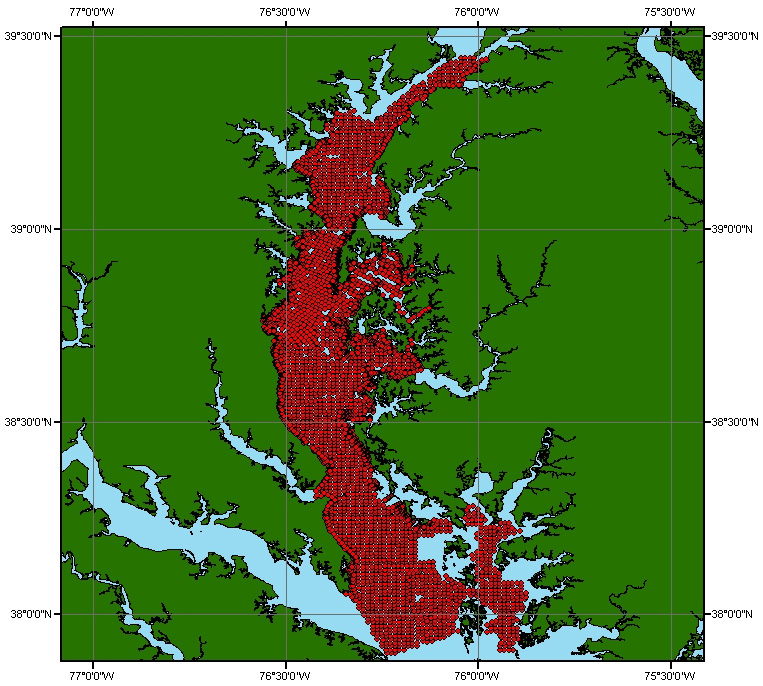
| 240 | Chesapeake Bay Earth Science Study (CBESS): Physical Properties of Surficial Sediments, Cheseapeake Bay, Maryland (Tabular Data) | 50724 | 44719 | 4255 | 4255 | -97.73185 | -75.8775 | 39.44167 | 19.63333 |
| 241 | Smithsonian Institution master sediment data file | 54979 | 48974 | 18790 | 20123 | -175.55 | 103.4683 | 84.135 | -66.175 |
| 245 | USGS OFR 98-596: Wrightsville Beach, NC | 73769 | 69097 | 18 | 18 | -77.80049 | -77.76108 | 34.22441 | 34.1766 |
| 246 | USGS OFR 00-295 (New York Bight Apex) & OFR 00-243 (Southern Long Island) | 73787 | 69115 | 575 | 575 | -73.9712 | -71.81784 | 41.06185 | 40.03861 |
| 247 | USGS OFR 00-304, Chapter 12, Eastern Long Island Sound | 74362 | 69690 | 18 | 18 | -72.19939 | -72.13677 | 41.30838 | 41.26606 |
| 248 | USGS OFR 00-304, Chapter 6 , Long Island Sound | 74380 | 69708 | 266 | 262 | -73.74664 | -72.04336 | 41.31032 | 40.86602 |
| 250 | USGS BLM/OCS Baltimore Canyon (Mid-Atlantic) data set | 74712 | 69970 | 499 | 674 | -75.31 | -71.8683 | 39.89 | 37.0767 |
| 252 | USGS OFR 99-010: Oculina Bank | 75211 | 70644 | 69 | 69 | -80.0325 | -79.9483 | 28.266 | 27.5412 |
| 264 | USGS OFR 02-217: Hudson Shelf Valley | 75280 | 70713 | 33 | 44 | -73.85759 | -73.238 | 40.39059 | 39.937 |
| 265 | USGS OFR 00-427: Western Massachusetts Bay | 75313 | 70757 | 98 | 98 | -70.83904 | -70.39452 | 42.51875 | 42.23197 |
| 266 | USGS/WHOI CONMAR analyses, part 1 | 75411 | 70855 | 2165 | 5028 | -82.00167 | -63.53333 | 46.08667 | 24.16667 |
| 267 | USGS/WHOI CONMAR analyses, part 2 | 77576 | 75883 | 3902 | 6286 | -82.00167 | -63.53333 | 46.08667 | 24.16667 |
| 268 | Atlantic Margin Coring Project (AMCOR): USGS OFR 76-844 | 81478 | 82169 | 28 | 402 | -80.5175 | -67.5975 | 42.17417 | 31.14283 |
| 269 | Atlantic Margin Coring Project (AMCOR): USGS OFR 81-239 | 81506 | 82571 | 19 | 205 | -80.5175 | -67.5975 | 42.17417 | 31.14283 |
| 270-306 | USGS OFR 03-001, Surficial sediment data from the Gulf of Maine | 81525-89610 | 82776-91184 | 34212 | 34537 | -75.033 | -65.067 | 44.906 | 33.443 |
| 307 | USGS OFR 00-358: East Coast Sediment Texture Database | 115739 | 117313 | 8467 | 10952 | -169.0833 | 170.52 | 55.28 | -16.23207 |