Surficial sediment character of the New York-New Jersey offshore continental shelf region: A GIS Compilation
|
|
Browse MapsOverviewSeveral examples of the maps and data products are shown below. For this publication we have chosen to focus on the Extracted and Parsed data within the dataset. The data are in no way limited to these few displays, and users are encouraged to review the definitions of the data files in the Data Dictionary (data_dictionary.htm). The images and maps in this Open-File Report serve as examples of products that may be generated using the usSEABED data provided in the Data Catalog section. A wide array of additional gridded maps and plots of sea floor sediment texture, character, and related geologic attributes from the New York-New Jersey offshore region can be constructed from the usSEABED data using Geographic Information Systems (GIS) applications (e.g. ArcView™, ArcExplorer™, MapInfo™). Data at a GlanceScatter plots of mean grain size (x-axis) vs. sorting (y-axis) for the Extracted data (top figure) and the Parsed data along the Atlantic coastal margin of the United States from USGS Data Series 118, Reid and others, 2005. Based on the sediment texture and character the samples are grouped into three primary facies: (A) Relict Cretaceous/ Pleistocene sediments, (B) Modern sand and gravel derived and reworked from older formations, and (C) Muds and muddy fine sands associated with estuarine outcrops on the shelf and the Hudson Shelf Valley. |
 Scatter plots of mean grain size (x-axis) vs. sorting (y-axis) for the Extracted data. |
 Parsed data along the Atlantic coastal margin of the United States from USGS Data Series 118, Reid and others, 2005. |
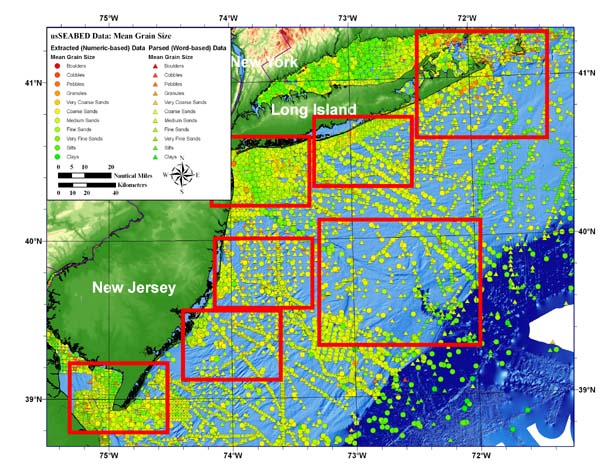
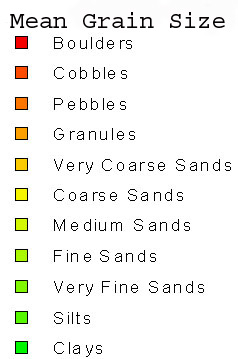
The map above of mean grain size is based on the extracted and parsed data from the usSEABED dataset (Reid and others, 2005). A larger version of the map may be viewed by selecting this link: main map. A precursory look at the map shows overall trends in sediment distribution. Long Island inner shelf regions (detail map) trend towards fine to medium sands (1-3 phi), while regions off northern New Jersey at the head of the Hudson Shelf Valley and down the thalweg tend toward finer grained sediments (>3phi) (detailed map). A predominance of fine grained sediments (muddy fine sand, mud) is also true of regions of Delaware Bay (detailed map) and outer edges of continental shelf (detailed map). Detailed maps of the areas below may be viewed by selecting the area within the red boxes.
Images are best viewed at full size. The images included in this publication are designed to be printed on 8.5" x 11" sheets of paper, and therefor are best viewed on screen at full resolution.
 . . |
|
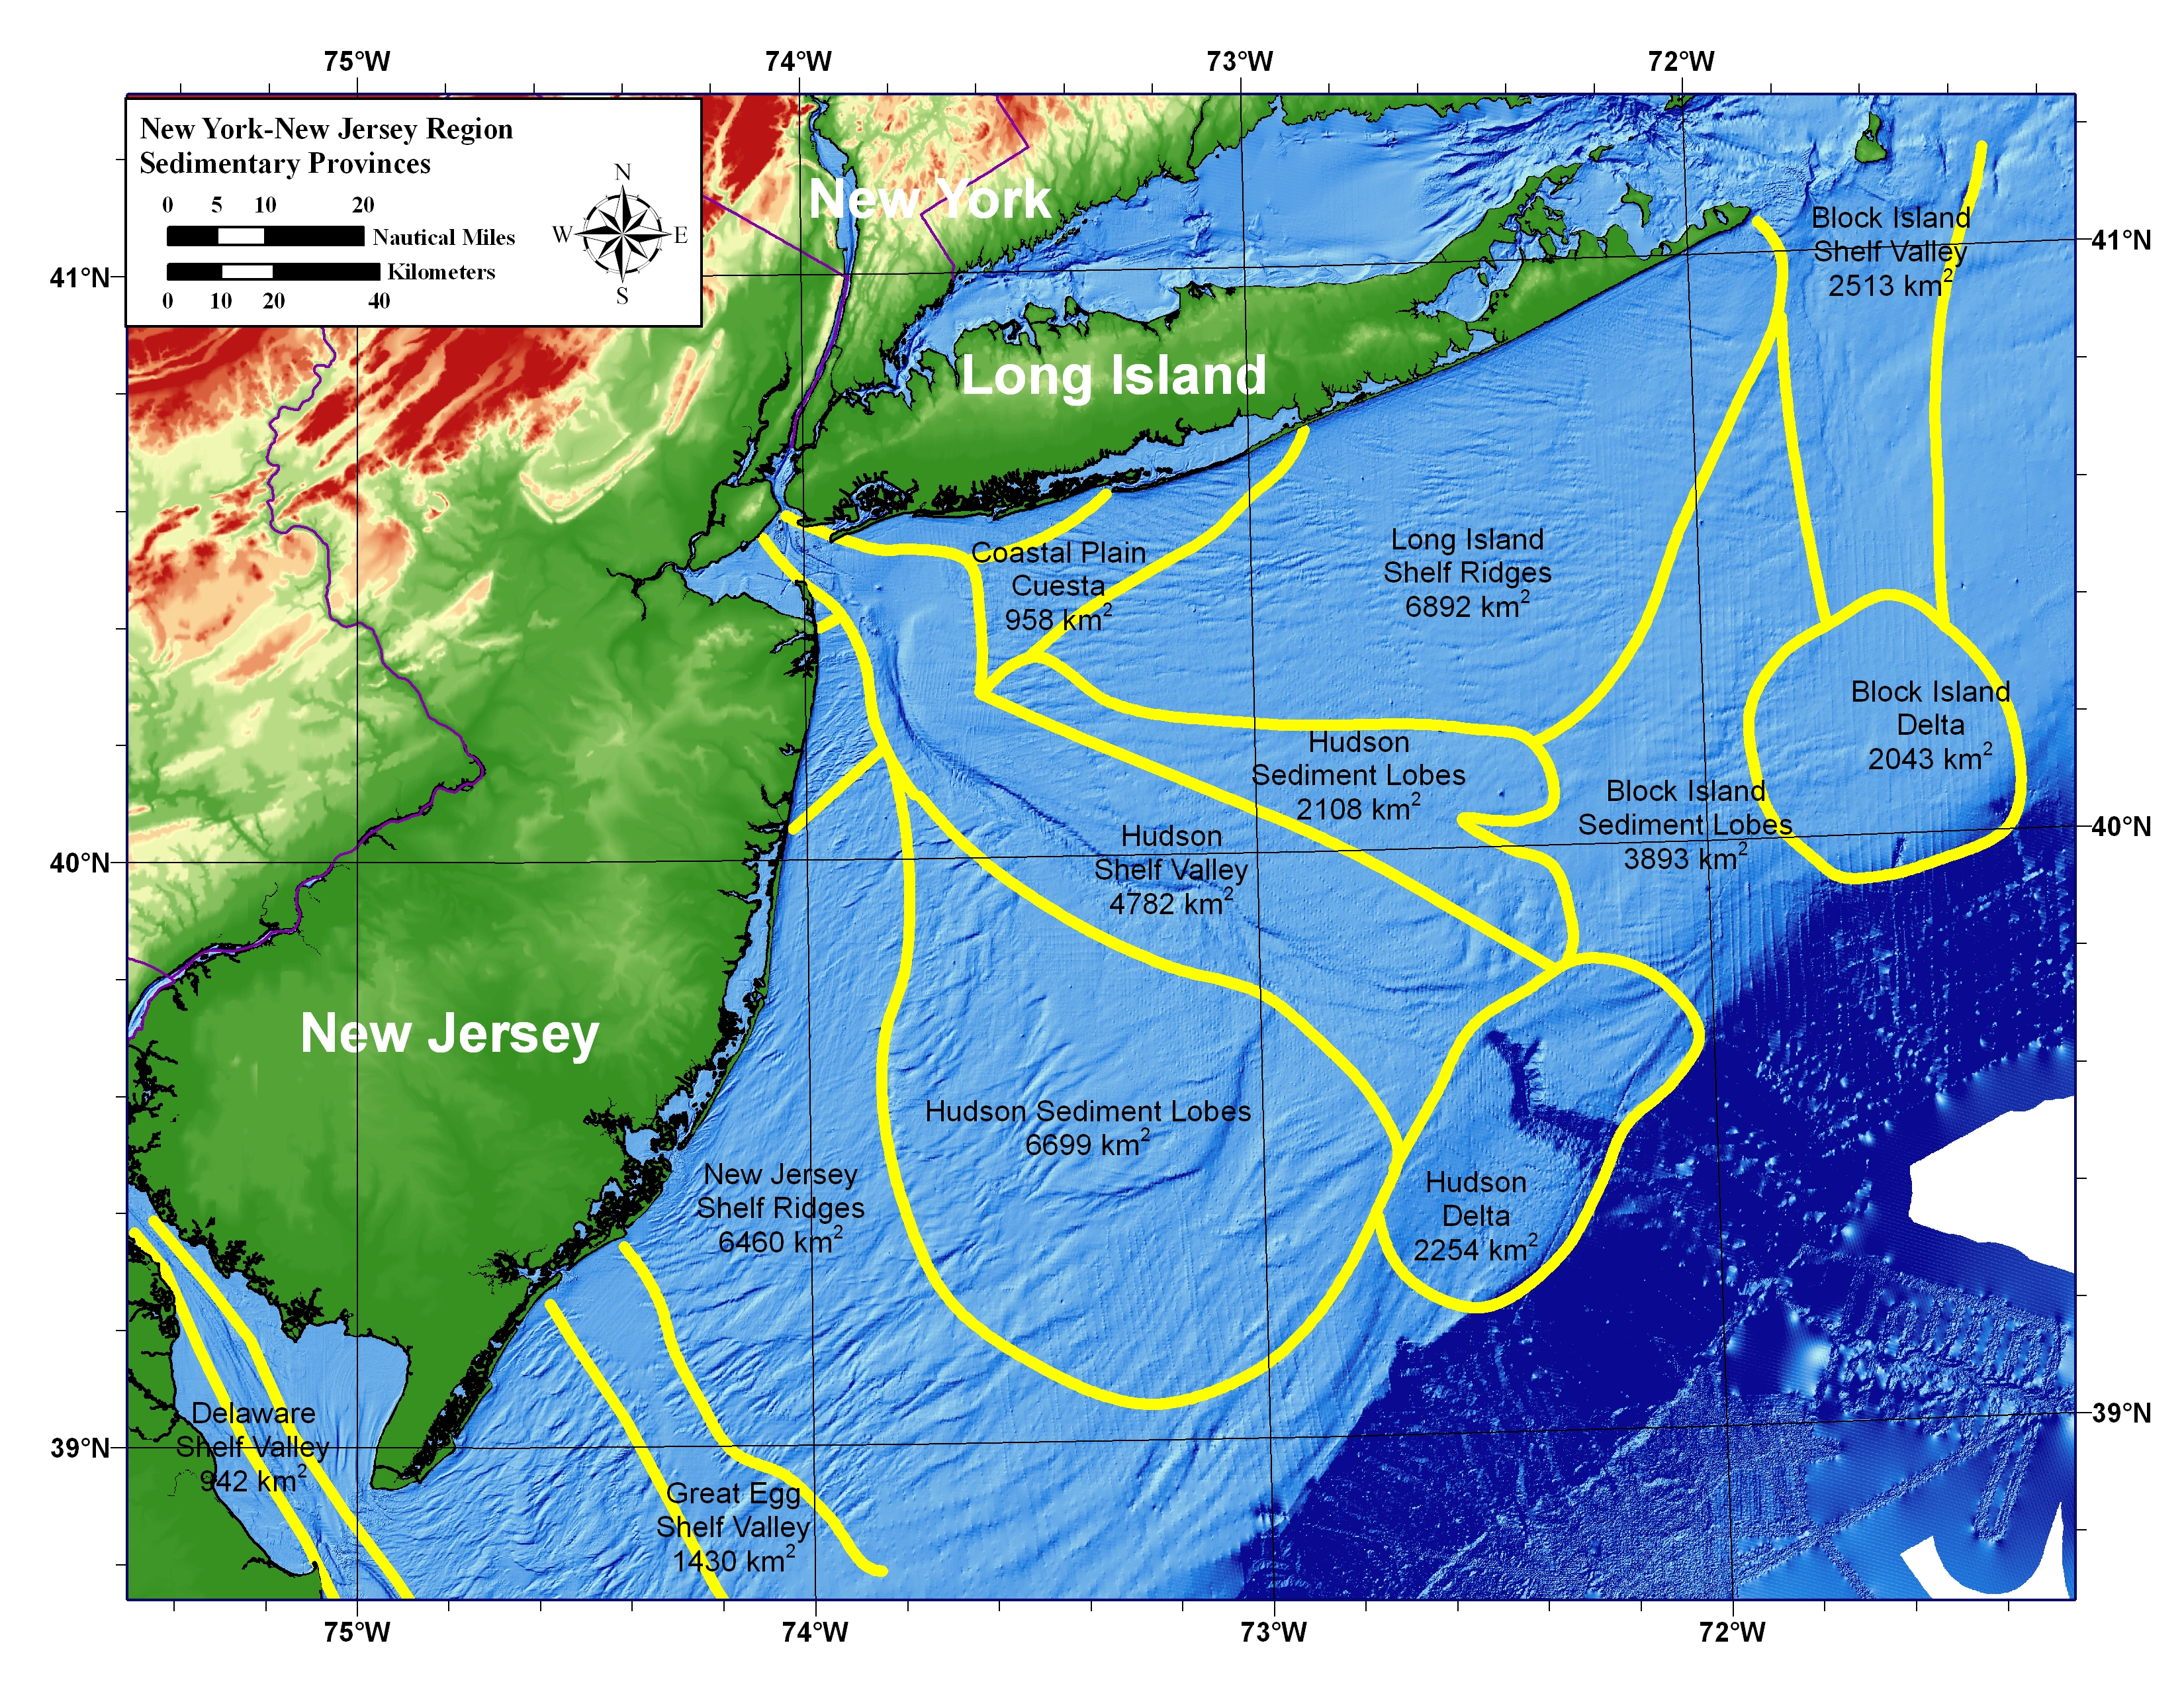 |
Map of the primary sedimentary provinces based on the underlying framework geology and sedimentary features comprising the sea floor. |
|
 |
Map of Shepard sediment classification based on extracted (numeric) data only. |
|
 |
Map of Shepard sediment classification based on parsed (word-based) data only. The parsed dataset greatly increases the amount of available data , and overall geographical coverage. |
|
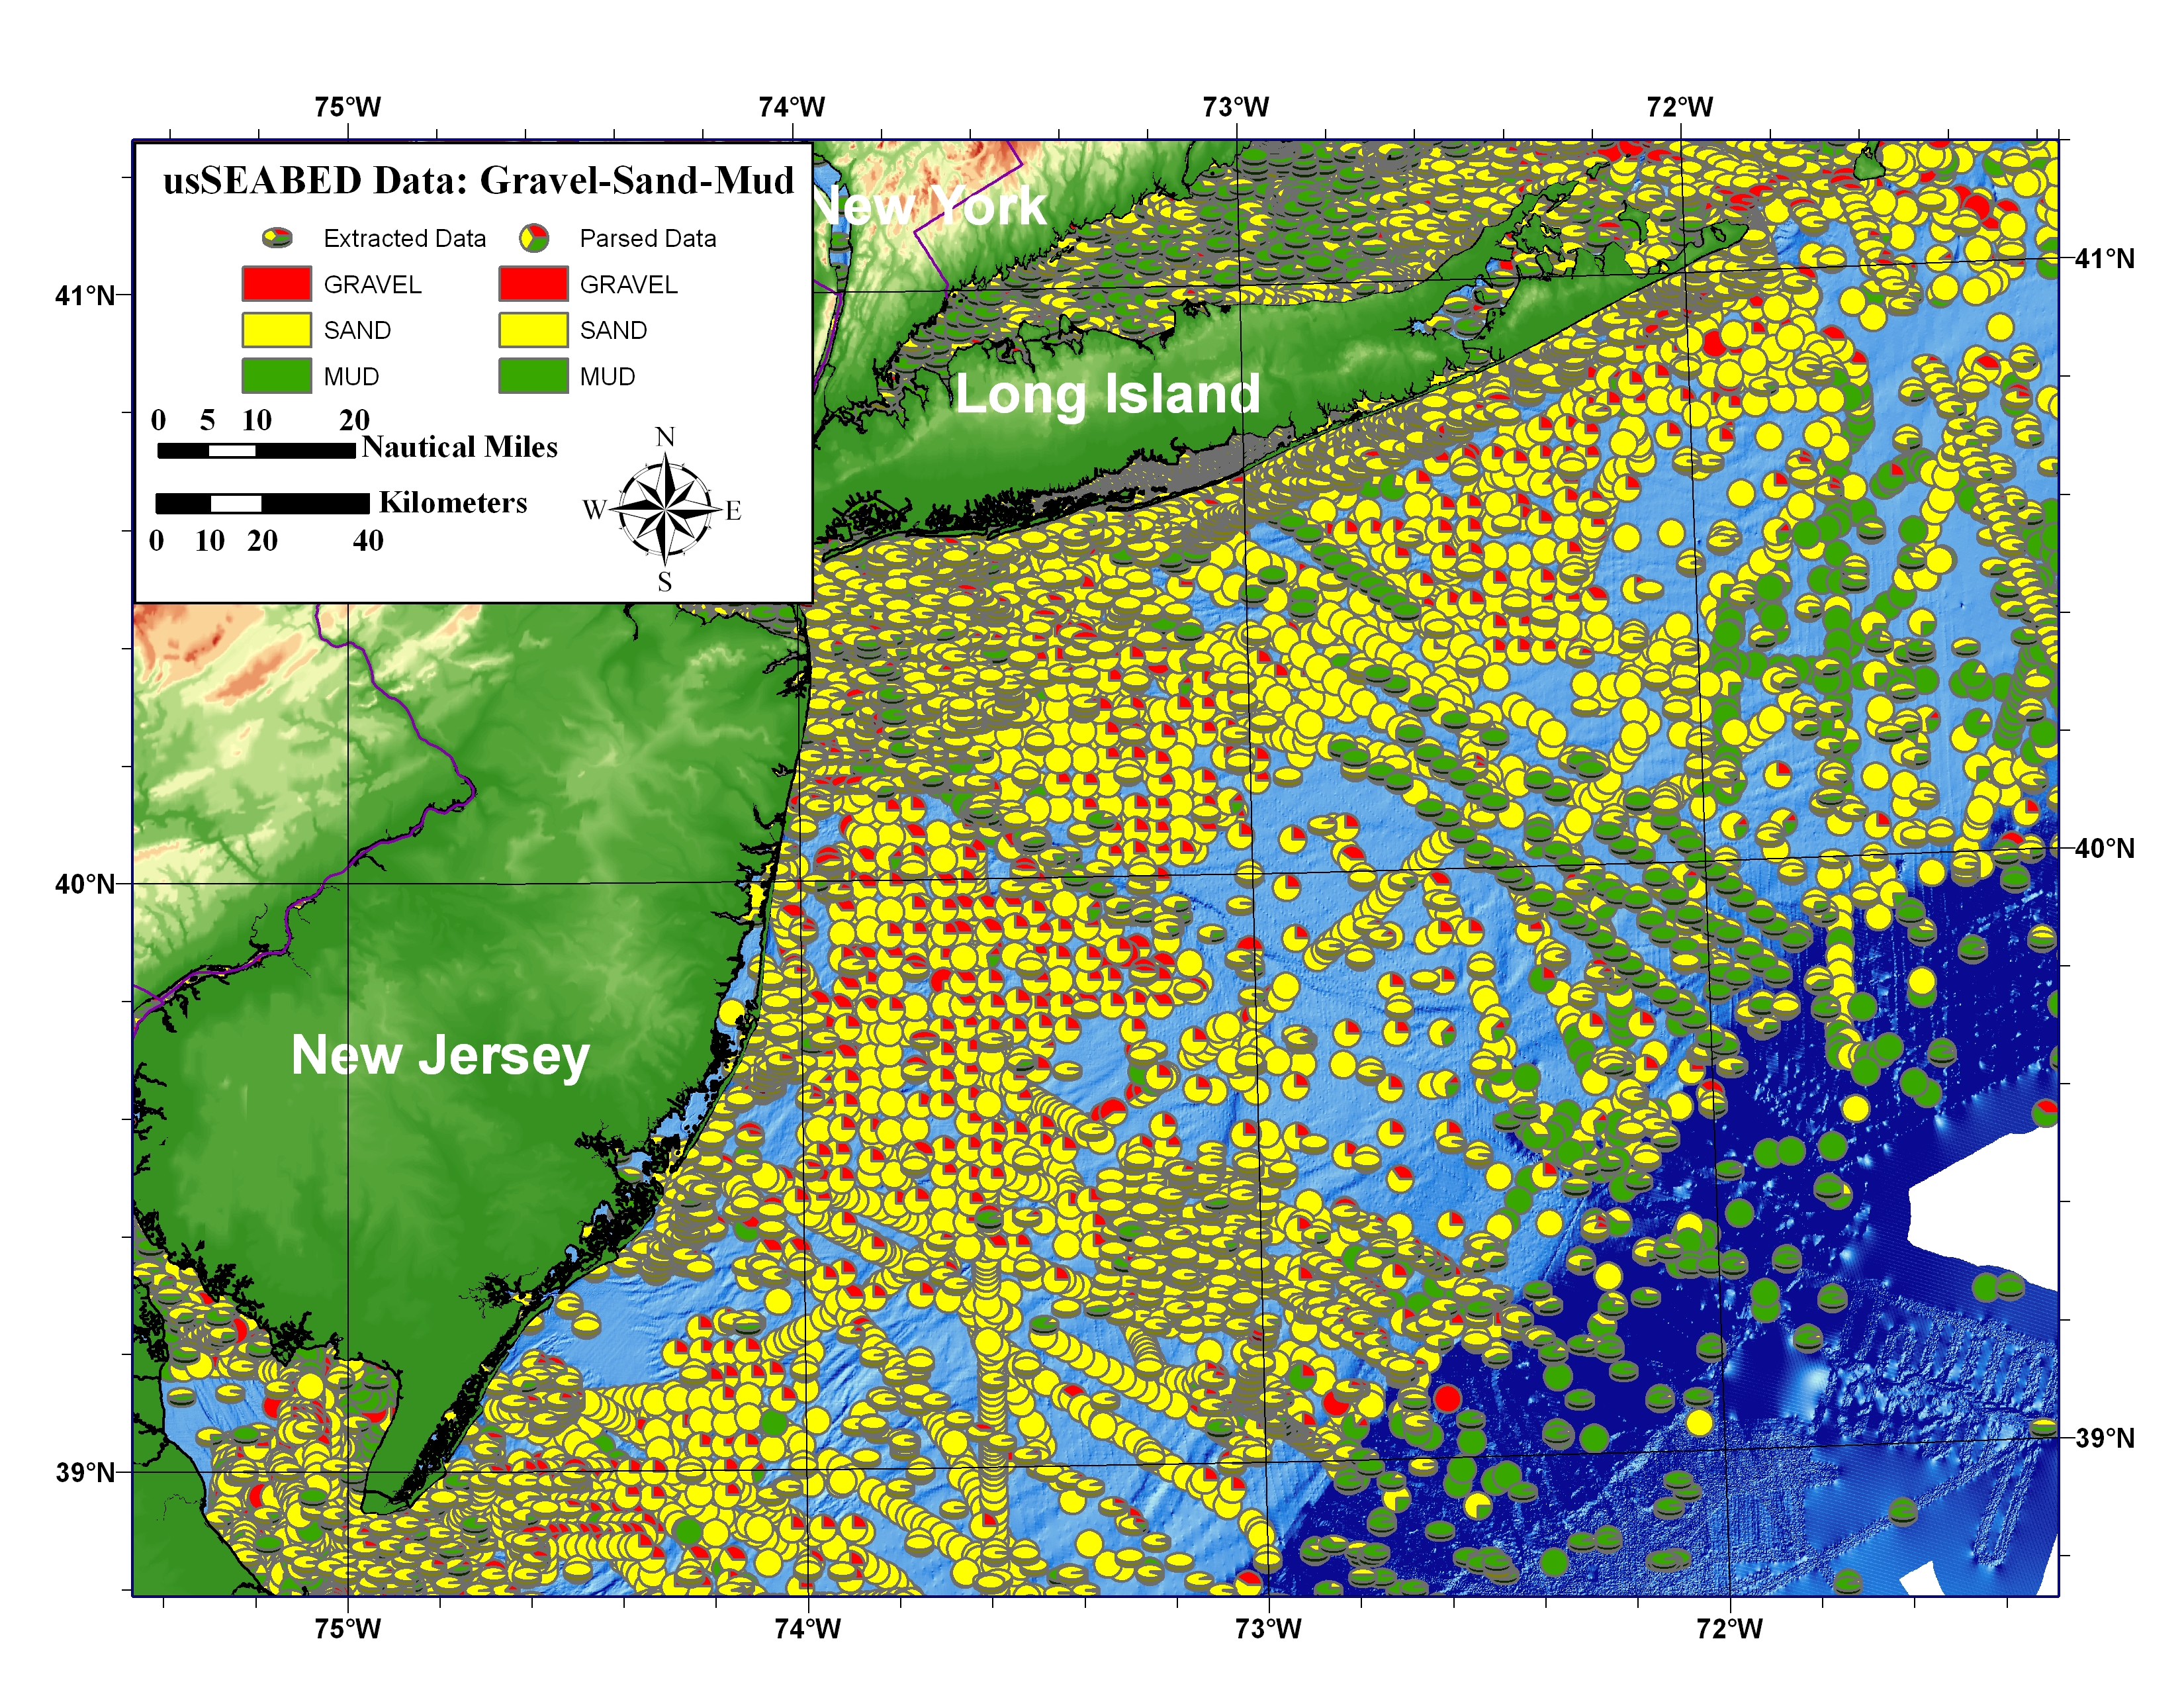 |
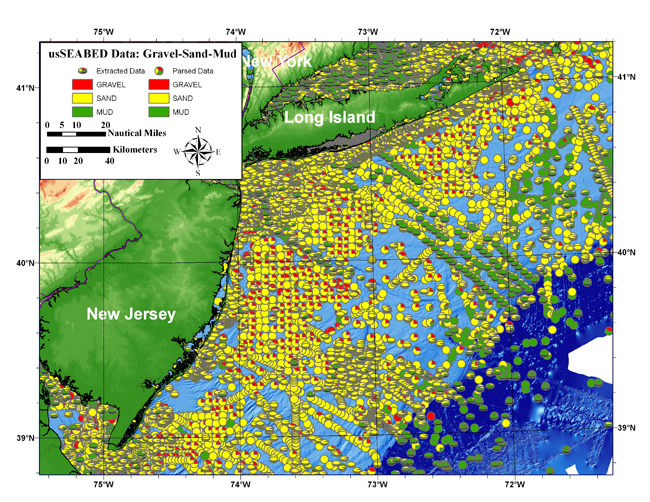
Map of gravel-sand-mud percentages. Map view symbols represent the parsed data, while oblique view symbols represent the extracted data. This type of a display offers more insight into the overall sediment composition than the simplified view of mean grain size. This is often the case for fish habitat studies, where sea floor composition is more important than generalized, or averaged, information. |
|
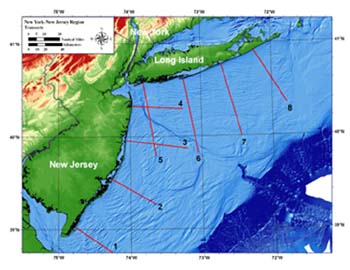 |
Example of shore-normal transects for Long Island and New Jersey, where usSEABED data may be examined superimposed on high resolution NOAA bathymetry. Click the image for a larger view, from which you will be able to click the line to bring up the transect details. |
|
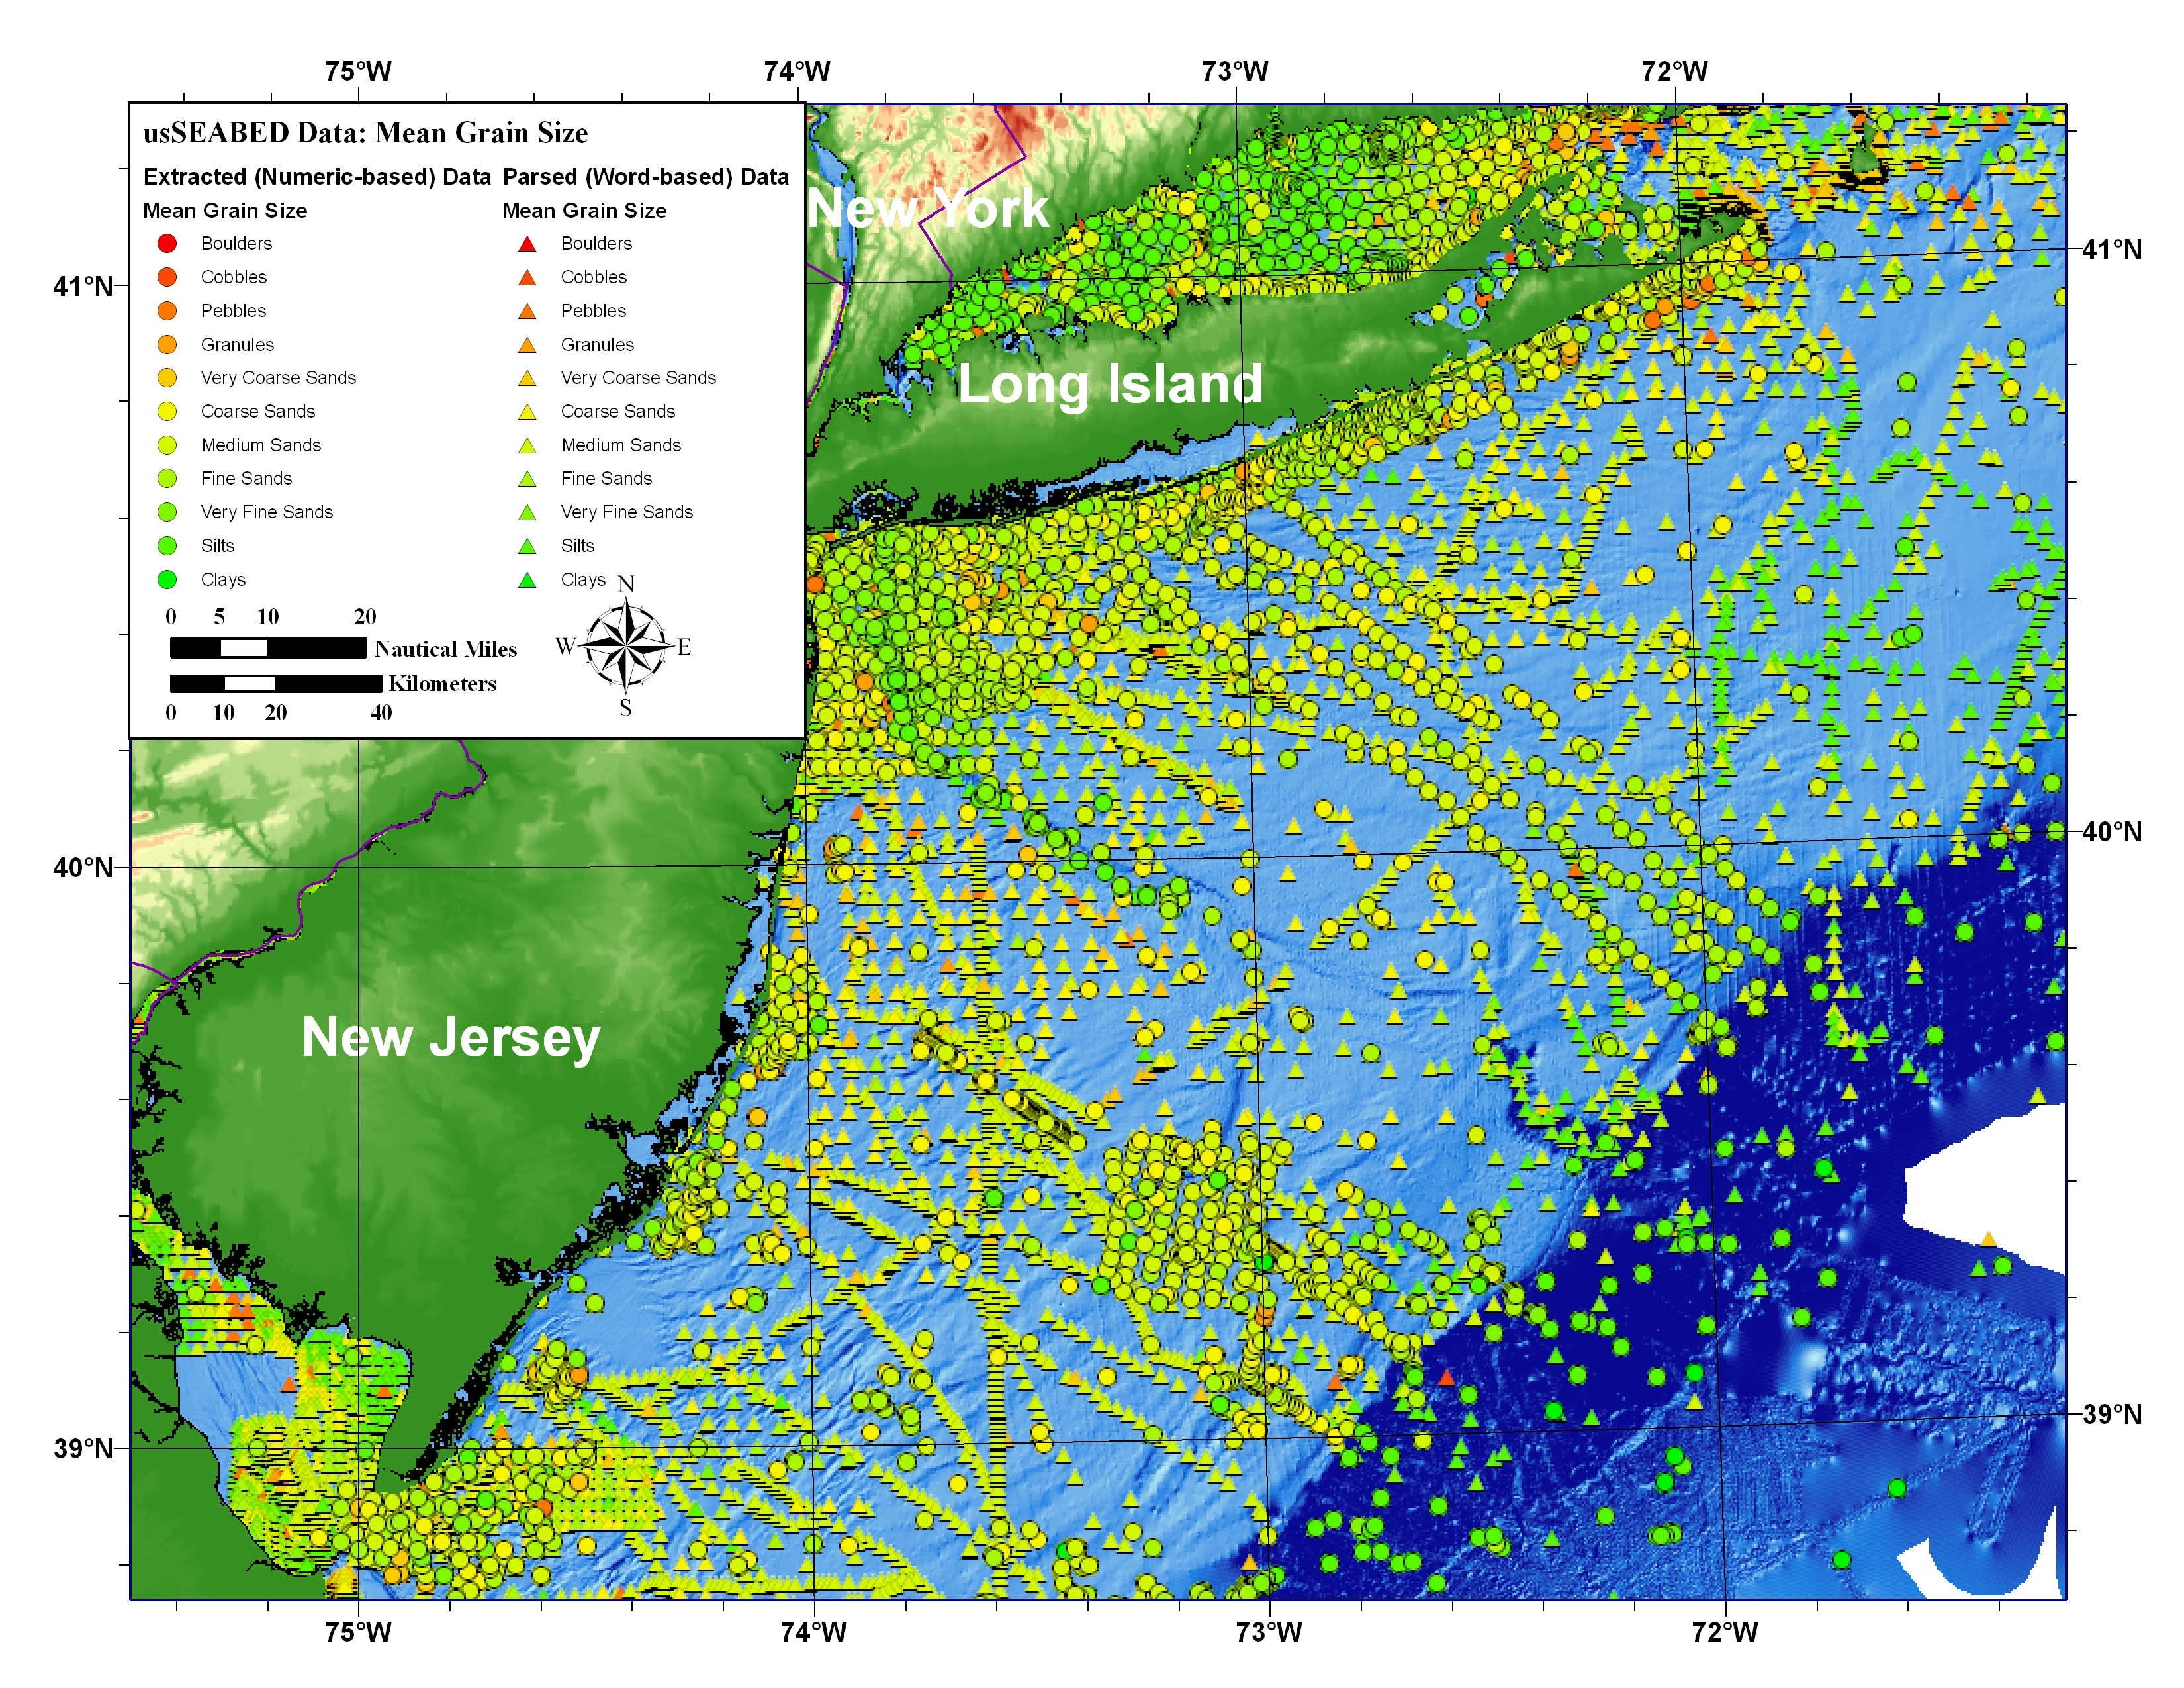 |
Map of mean grain size based on both extracted and parsed data in usSEABED. This is the same shown above, with the detail boxes in red. |
|
 |
Map of sediment sorting of extracted and parsed data (over 29,000 samples for the New York-New Jersey region). |
|
![]() To view files in PDF format, download free copy of Adobe Reader.
To view files in PDF format, download free copy of Adobe Reader.
Main Menus
OFR 2006-1046 Home | Introduction | Nomenclature | Sea-Floor Photos
| Data Dictionary |
Data Catalog | Browse Maps | References | Related Websites | Acknowledgments | Contacts | For Educators | Disclaimer | README
Sub-Menus
Browse Maps | Mean Grain Size | Facies Divisions | Examples

![]() U.S. Department of the Interior |
U.S. Geological Survey
U.S. Department of the Interior |
U.S. Geological Survey
URL: pubsdata.usgs.gov/pubs/of/2006/1046/htmldocs/browse_maps.htm
Page Contact Information: Publishing Services
Page Last Modified: Saturday, 12-Jan-2013 22:23:08 EST
