Back to For Educators Page Presentation

Slide 1. Title Image: Regional scale understanding of the geologic character and sand resources of the Atlantic inner continental shelf, Maine to Virginia. Click for larger image
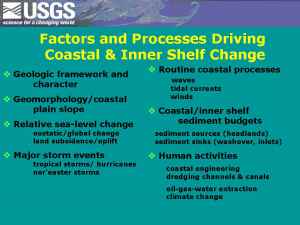
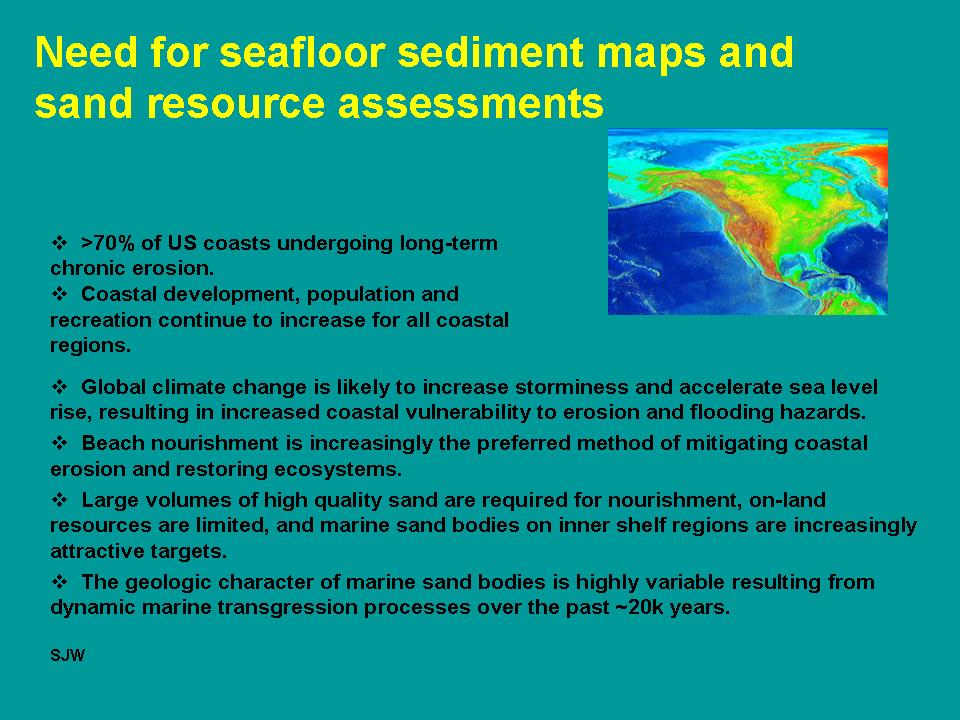
Slide 2. Coastal change is driven by many factors, including local geology, geomorphology, sea-level change and weather. Click for larger image
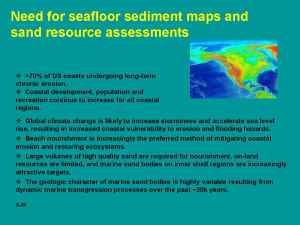
Slide 3. Scientific knowledge and understanding of the sea floor composition and morphology is important in understanding coastal change.Click for larger image
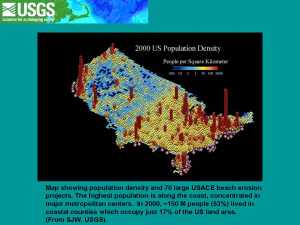
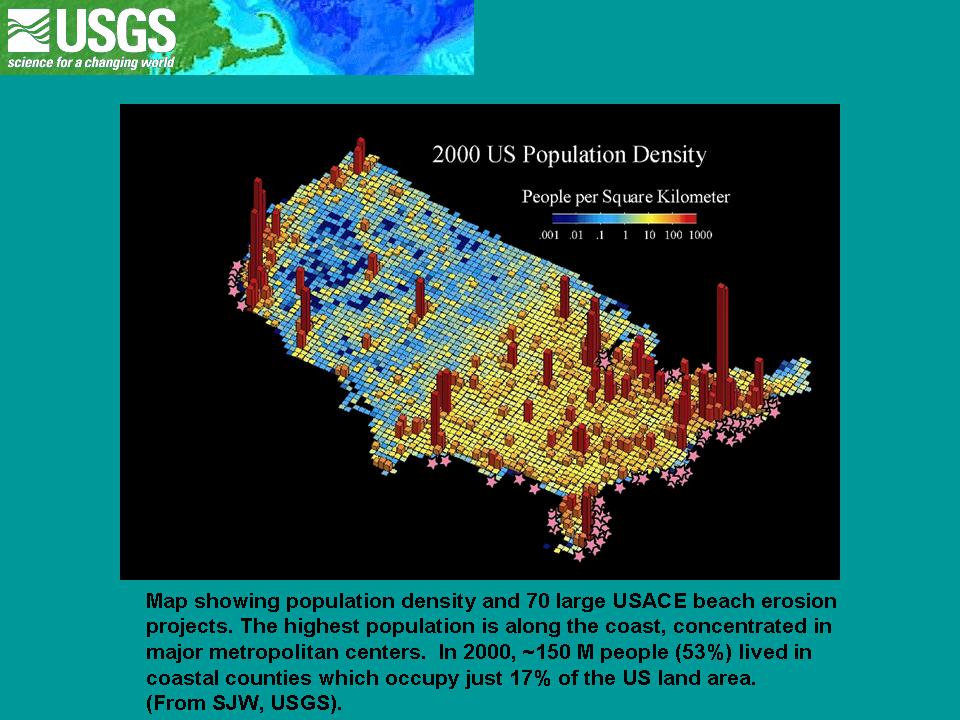
Slide 4. Population density map of the continental U.S., highlighting the proximity of large population and development in the coastal areas. Click for larger image
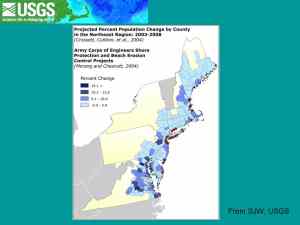
Slide 5. Map showing the projected increases in population for the Northeast region.Click for larger image
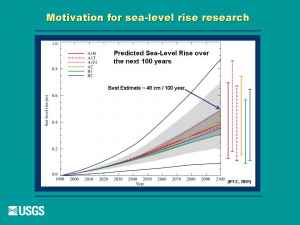
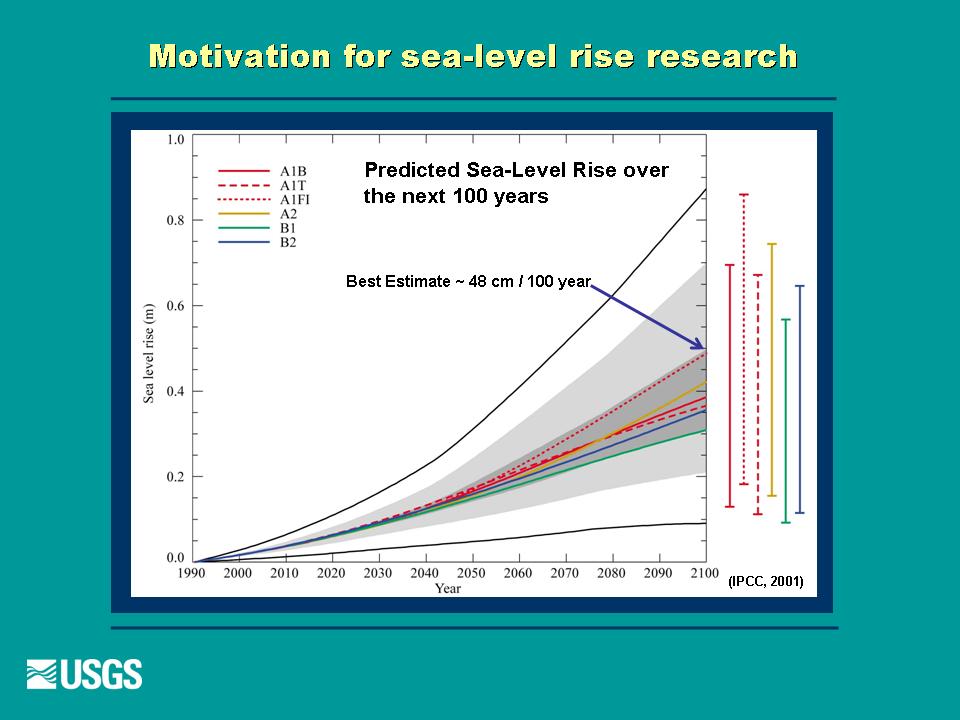
Slide 6.Slide 6. Chart of the projected sea-level rise for the next 100 years. Click for larger image
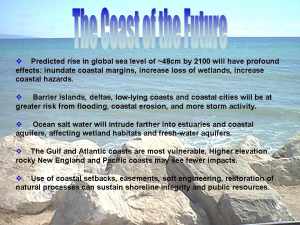
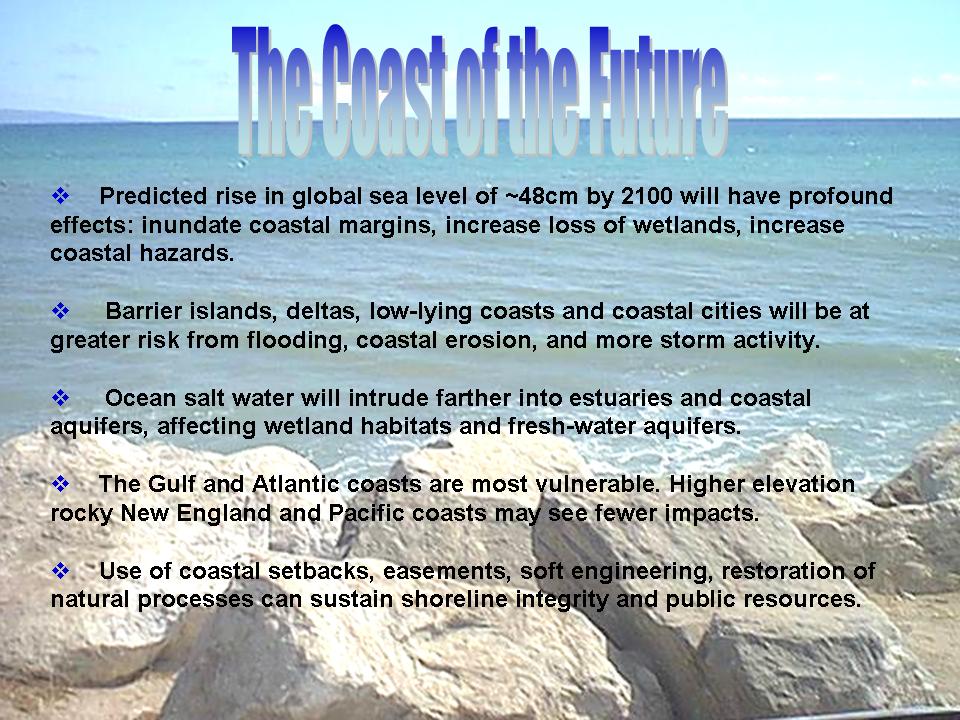
Slide 7. Sensitive coastal areas will feel the most dramatic effects of sea level rise in future decades. Click for larger image

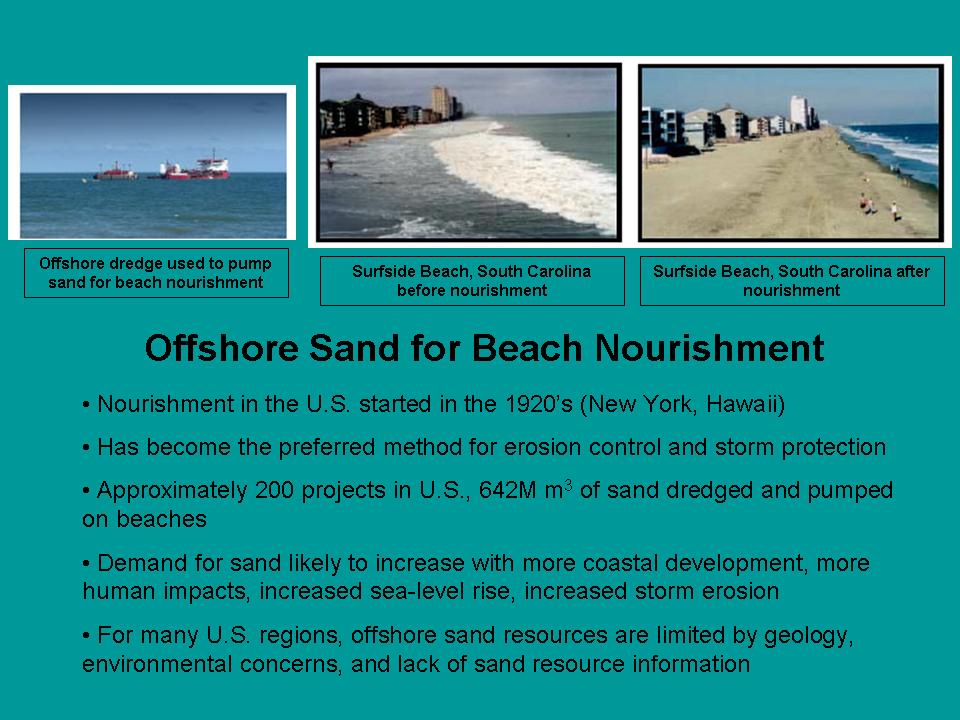
Slide 8. The importance and practicality of considering use of offshore sand resources for beach nourishment to mitigate erosion. Click for larger image
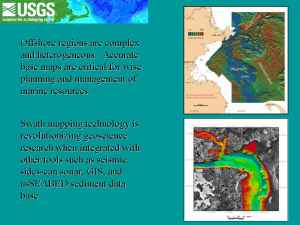
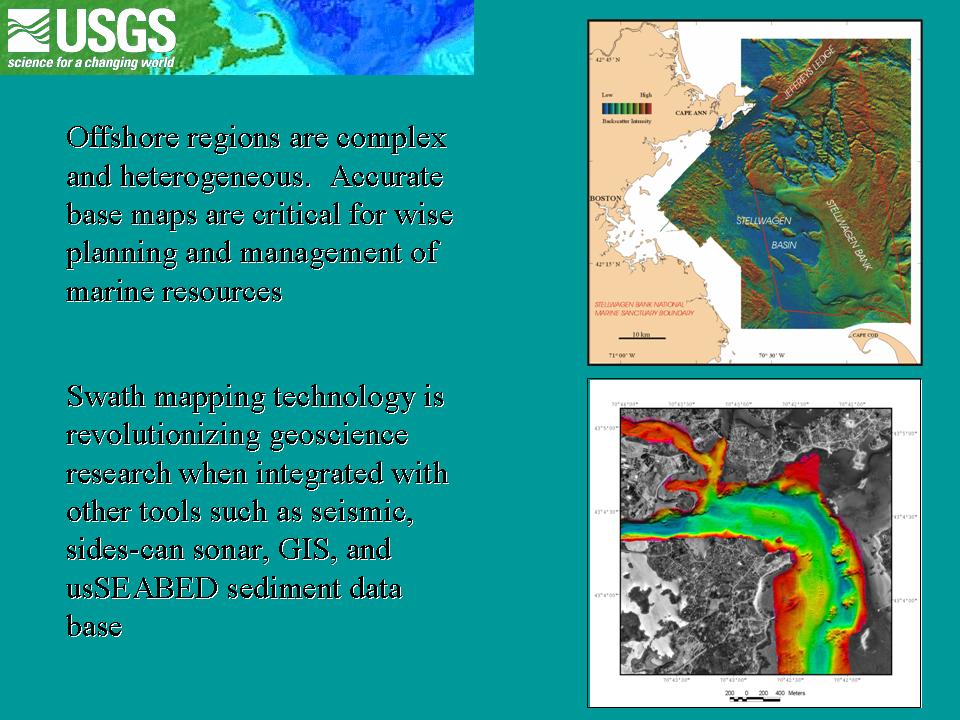
Slide 9. The heterogeneous nature of offshore deposits makes base maps essential tools in management and planning for coastal areas. Click for larger image
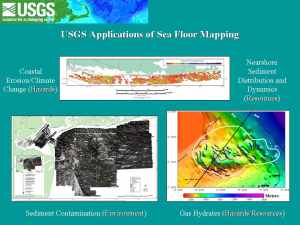
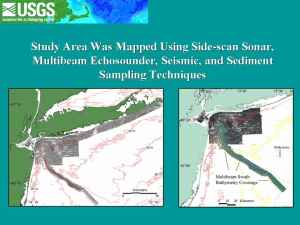
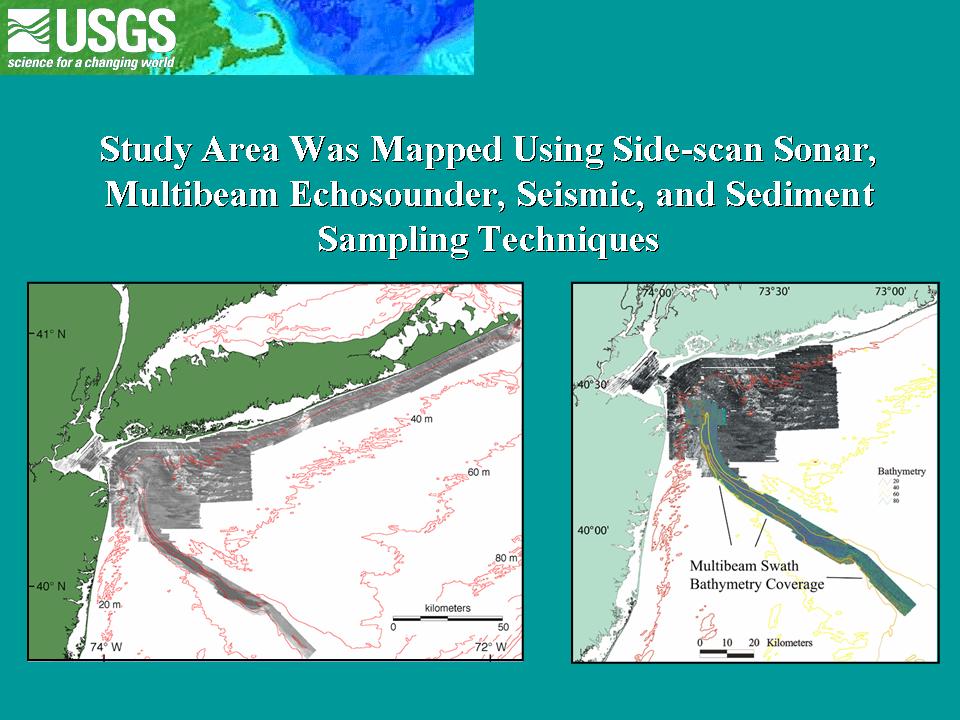
Slide 10. Examples of surveys done by the USGS in sea floor mapping. Click for larger image

Slide Regional studies by the USGS and Army Corps of Engineers in the New York Bight region. Click for larger image
Slide 12. Multidisiplinary studies of New York Bight and coastal Long Island. Click for larger image
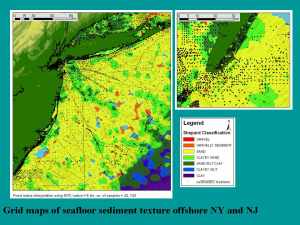
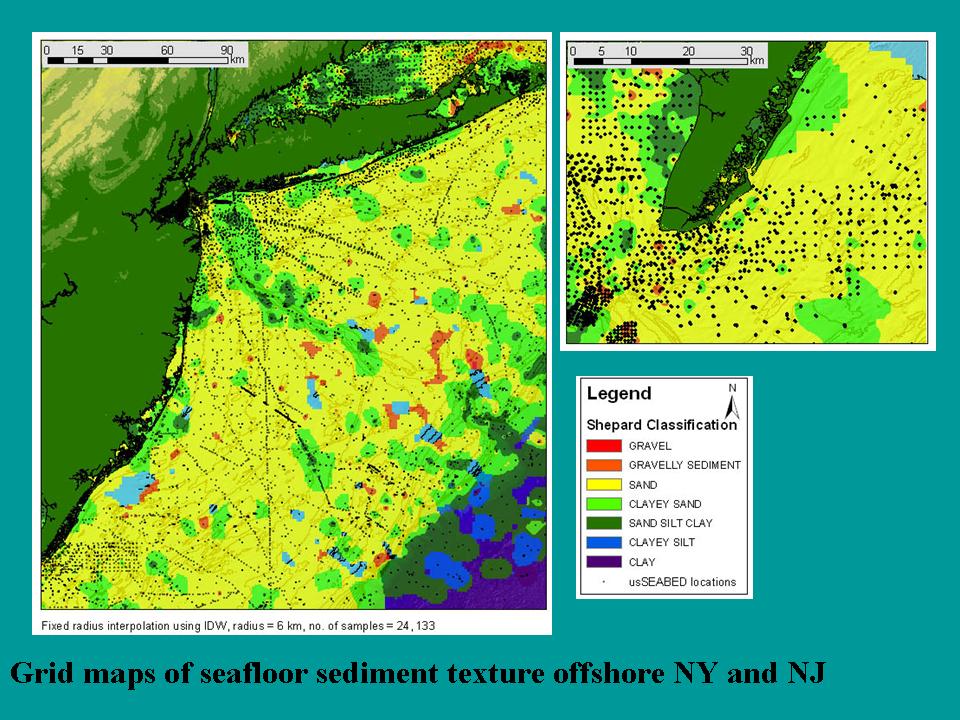
Slide 13. Sea-floor sediment texture maps produced using usSEABED data. Click for larger image
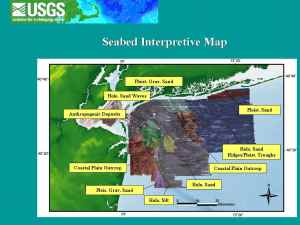
Slide 14. Interpretive map of sea-floor composition in New York Bight. Click for larger image
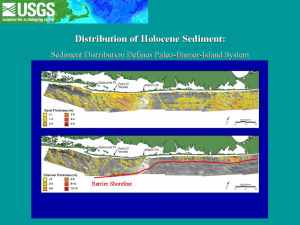
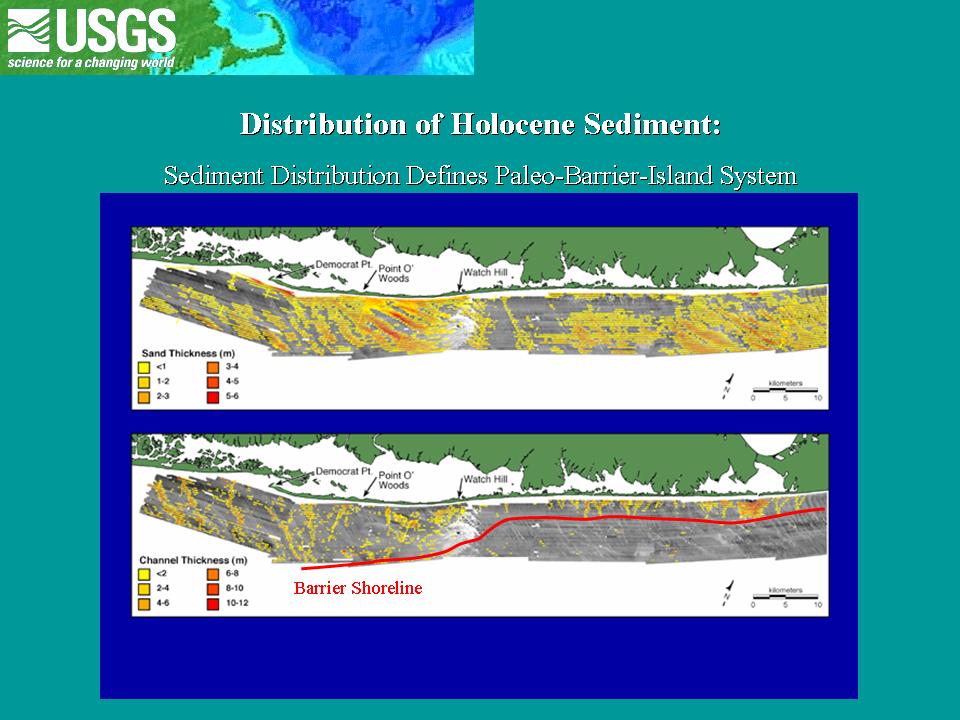
Slide 15. Distribution of Holocene sediments along southern Long Island, and paleobarrier island system. Click for larger image

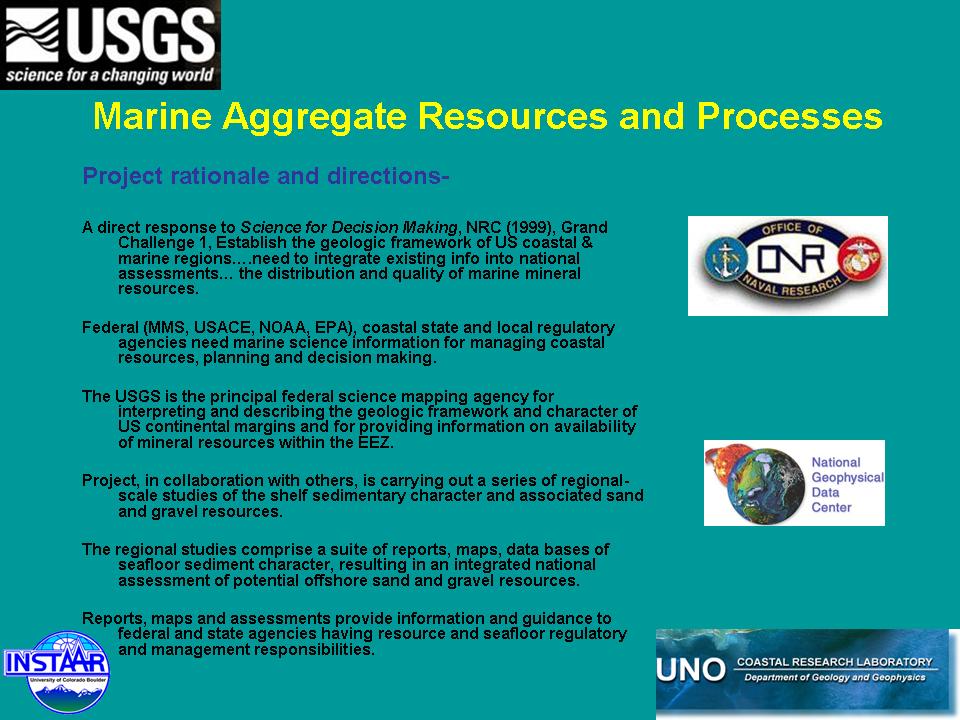
Slide 16. The USGS Marine Aggregate Resources and Processes rationale and focus. Click for larger image
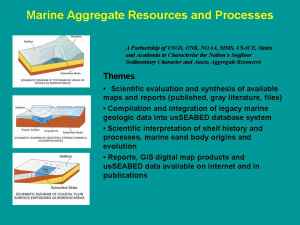
Slide 17. The USGS Marine Aggregate Resources and Processes scientific and data product goals. Click for larger image
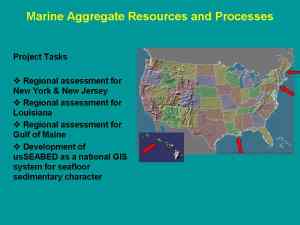
Slide 18. The USGS Marine Aggregate Resources and Processes projects and targeted geographic regions for assessments. Click for larger image
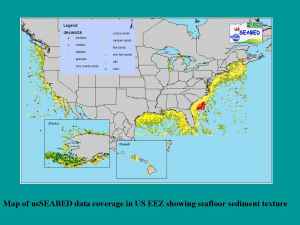
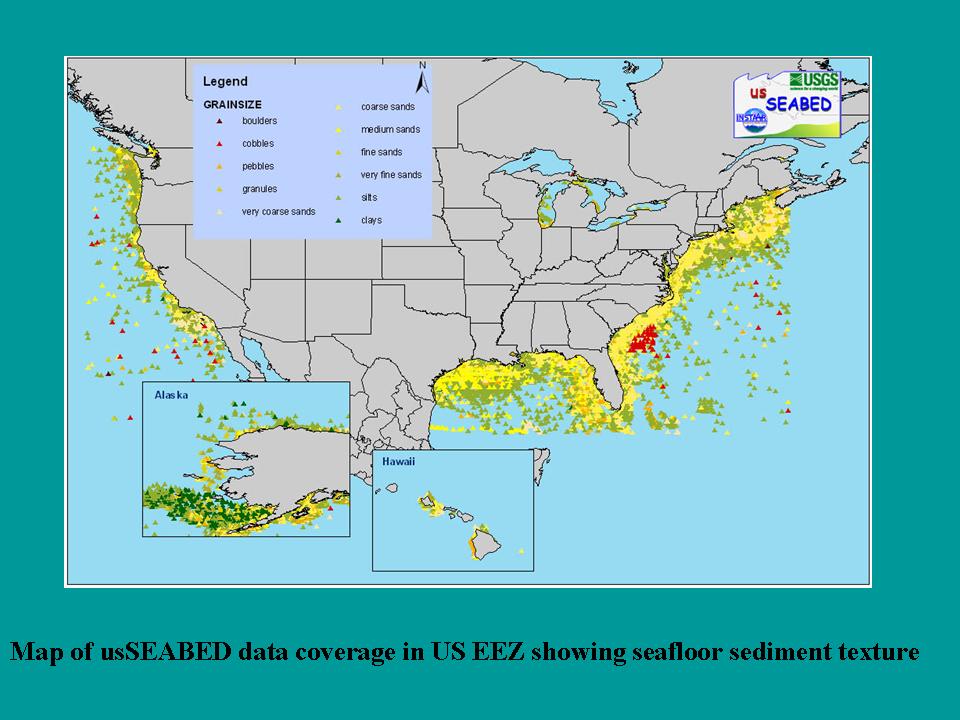
Slide 19. The usSEABED data coverage within the U.S. Exclusive Economic Zone of the continental United States. Click for larger image
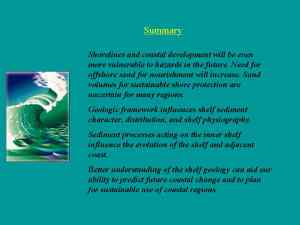
Slide 20. Summary of coastal processes and the USGS Marine Aggregate Resources and Processes contribution to better understanding of these processes. Click for larger image
|

