Western Coastal and Marine Geology
U.S. Geological Survey
Open-file Report 2006-1177
Benthic Habitat and Geologic Mapping of the outer Continental Shelf of North-Central California |
||||||||||
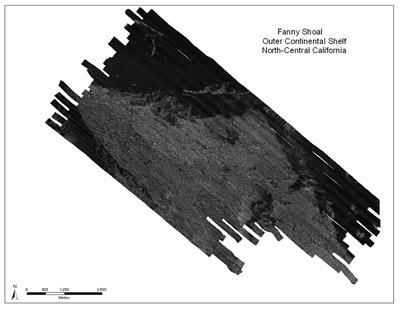
METHODSBenthic habitat and geologic mapping of Fanny Shoal were conducted with combined side-scanning sonar and video over three separate cruises onboard the ship McArthur II; in July 2003, April 2004, and April 2005. Shallow water outcrops of north Farallon Island limited survey coverage to the south of the site. Seafloor features are revealed in the acoustic-reflectance data collected in 2004, using side-scanning sonar. Additional information about the crusie and images of from the camera sled, side-scanning sonar equipment, and the R/V McArthur II are available on the Sanctuary Integrated Monitoring Network (SiMON) website at the following URL: http://www.mbnmssimon.org/other/moreLinks/whats_new_mac.php. The principal objectives of video data collection were to ground-truth these geophysical data to help construct maps of substrate morphology and habitat distribution. Therefore, transect locations were selected on the basis of the existence, quality, and complexity of geophysical data and on regions of geologic transition and/or biologic significance. Side-scanning SonarSide-scanning sonar imaging provides high-resolution images of the sea floor by recording the intensity of sound reflected off the sea floor (acoustic backscatter). The side-scanning data were processed using the USGS Mini Image Processing System (MIPS) Chavez (1984) and mosaicked into a continuous image of the study area. The georerenced side-scanning data layer is an image built from data with a horizontal resolution of 0.6 m with grayscale values proportional to the acoustic backscatter of the sea floor. Sonar images of the sea floor were produced from 100 KHz side-scanning sonar records obtained with a Klein 2000 sonar.
Figure 3. Side-scanning map of Fanny Shoal, outer continental shelf of north-central California. To view a large version of Figure 3 in a new window, click on the image above.
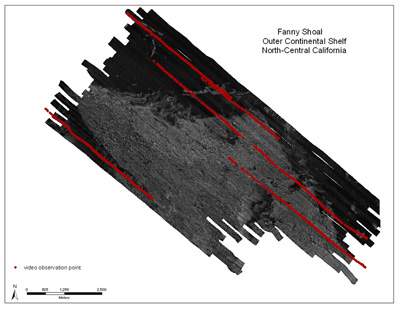
Seafloor Video ObservationA video sled equipped with forward- and downward-looking video cameras, lights, altimeter, and a pressure (depth) sensor was towed 1-2 m above the seafloor to record geologic and biologic features. Two lasers spaced 20 cm apart provided scale. Height above the seafloor, pitch, roll, water depth, ship latitude and longitude (determined by a CSI Wireless differential geographic positioning system (dGPS)), ship speed (generally <1.5 knots), ship heading, and Greenwich Mean Time (GMT) were imprinted on the digital video tape. Positional accuracy of the ship is on the order of 10 meters. Real-time observations of sea-floor characteristics were digitally recorded at 1-min. intervals during 6 video transects (~12 hours). Observations at each point included primary and secondary substrate type (e.g., rock, sand, mud), substrate complexity (rugosity), seafloor slope, benthic biomass (low, medium, or high), the presence and absence of benthic organisms and demersal fish, and small-scale sea-floor features (e.g., ripples, tracks, burrows). Real-time observations were recorded to a digital data file along with time, dGPS position, and other ship data.
Figure 4. Video observation points and track lines for the Gulf of Farallones National Marine Sanctuary. To view a large version of Figure 4 in a new window, click on the image above.
Data ProcessingTextural image analysis of the side-scanning sonar image was used to generate a habitat classification of the sea floor, a method which has been used successfully in other side-scanning sonar mapping studies (Blondel, 1996). Textural image analysis involves the calculation of image homogeneity and entropy (as defined by Shokr, 1991). Entropy measures the roughness of acoustic texture, and homogeneity measures the degree of organization of the texture (Blondel and Murton, 1997). These values were computed for approximately 20x20 pixel training regions, called "signatures," for areas identified in the point coverage of visual observations, as was done in an analysis by Cochrane and Lafferty (2002). These signatures were then used to perform a supervised classification of the entire side-scanning sonar image. By comparison to the video observation, the resulting classified image was edited to remove areas where sonar noise or attenuation resulted in misclassification. The classified images were also low-pass filtered to reduce the number of polygons to less than 100,000 when the images were converted to polygon features. The classified image was then converted to an ArcInfo grid followed by a polygon coverage with a bottom type attribute, as defined by Greene and others (1999), which consists of either "h" for hard bottom, "m" for mixed low relief rocky bottom and soft sediment, or "s" for soft sediment bottom type. The polygon coverage was edited to remove areas where noise or other sonar data degradation produced erroneous classification. A low-pass filter was used to fill in unclassified pixels and generalize the classification to reduce the number of polygons. A "megahabitat" attribute was added to all the polygons at this point; all polygons in the Fanny Shoal study area are classified as "S" for "Shelf." The bottom-camera-video observations were combined in an ArcGIS point shapefile, which can be overlain on the sonar images to aid in interpretation. The bottom observations were used to select areas of the image that represented rocky sea floor for textural image analysis (discussed above). The observations were also used to identify macrohabitat, the third polygon habitat attribute of Greene and others (1999).
|
Introduction Methods Results |
|||||||||
|
||||||||||
Accessibility
|
FOIA
| Privacy
|
Policies and Notices
U.S. Department of the Interior
U.S. Geological Survey
URL: http://walrus.wr.usgs.gov/
maintained by Michael Diggles
last modified October 2, 2006 (mfd)