Report Site Map > Graphics of Streamflow and Nutrient Flux > Graphics of Streamflow and Nutrient Flux Delivered from the Mississippi-Atchafalaya River Basin to the Gulf of Mexico > Graphics of Monthly Nutrient Flux and Concurrent Streamflow to the Gulf of Mexico
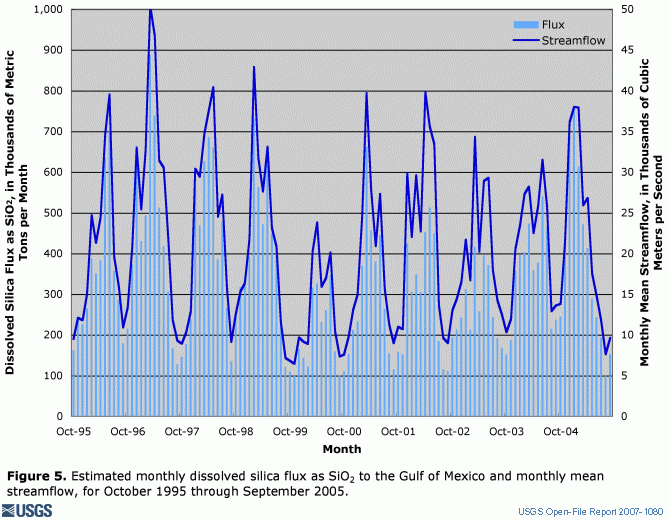
The following graphs depict monthly flux of dissolved nitrite plus nitrate (figure 1), total nitrogen (figure 2), total phosphorus (figure 3), dissolved orthophosphate (figure 4), and dissolved silica (figure 5), along with concurrent annual streamflow delivered to the Gulf of Mexico by the Mississippi-Atchafalaya River Basin.
| Click on graphs for larger versions. |
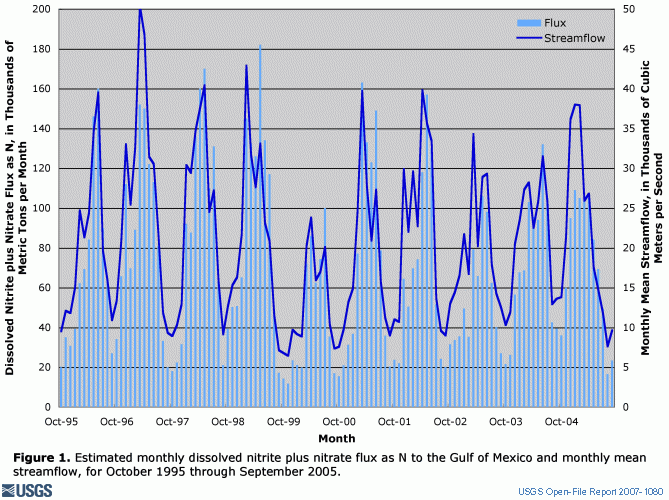 Figure 1. Estimated monthly dissolved nitrite plus nitrate flux as N to the Gulf of Mexico and monthly mean streamflow, for October 1995 through September 2005. |
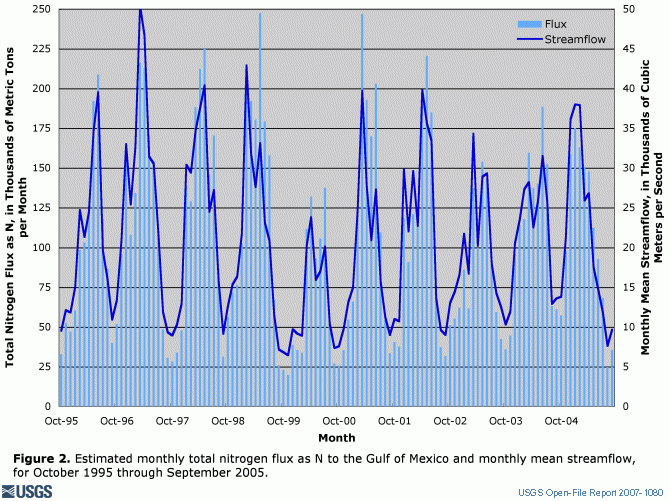 Figure 2. Estimated monthly total nitrogen flux as N to the Gulf of Mexico and monthly mean streamflow, for October 1995 through September 2005. |
|
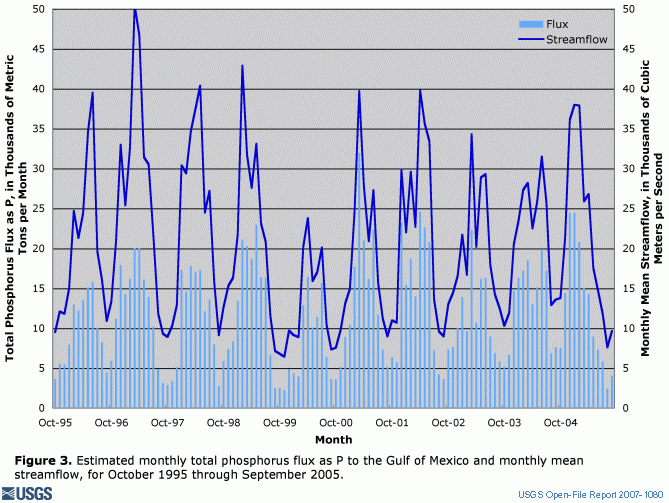 Figure 3. Estimated monthly total phosphorus flux as P to the Gulf of Mexico and monthly mean streamflow, for October 1995 through September 2005. |
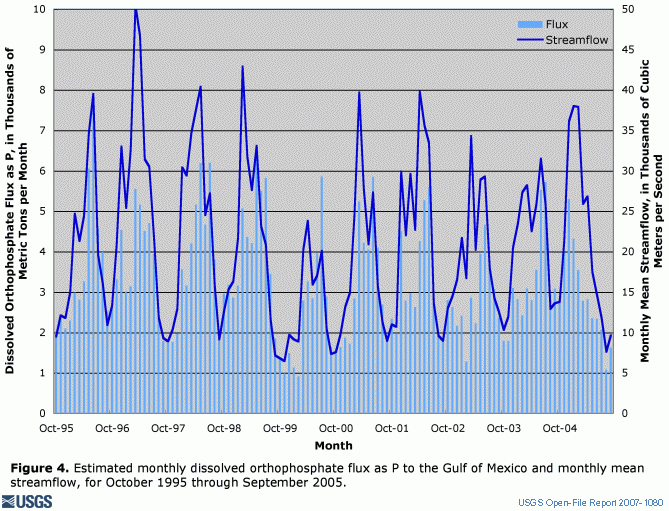 Figure 4. Estimated monthly dissolved orthophosphate flux as P to the Gulf of Mexico and monthly mean streamflow, for October 1995 through September 2005. |
|
|
||
| Click on graphs for larger versions. |
The data used to generate the above graphs are available on the following page.
Report Site Map > Graphics of Streamflow and Nutrient Flux > Graphics of Streamflow and Nutrient Flux Delivered from the Mississippi-Atchafalaya River Basin to the Gulf of Mexico > Graphics of Monthly Nutrient Flux and Concurrent Streamflow to the Gulf of Mexico

![]() U.S. Department of the Interior |
U.S. Geological Survey
U.S. Department of the Interior |
U.S. Geological Survey
URL: http://pubsdata.usgs.gov/pubs/of/2007/1080/of-2007-1080/graphics/delivery_graphics/monthly_graphics.html
Page Contact Information: GS Pubs Web Contact
Page Last Modified: Wednesday, 05-Mar-2025 15:45:02 EST