U.S. Geological Survey Open-File Report 2007-1311
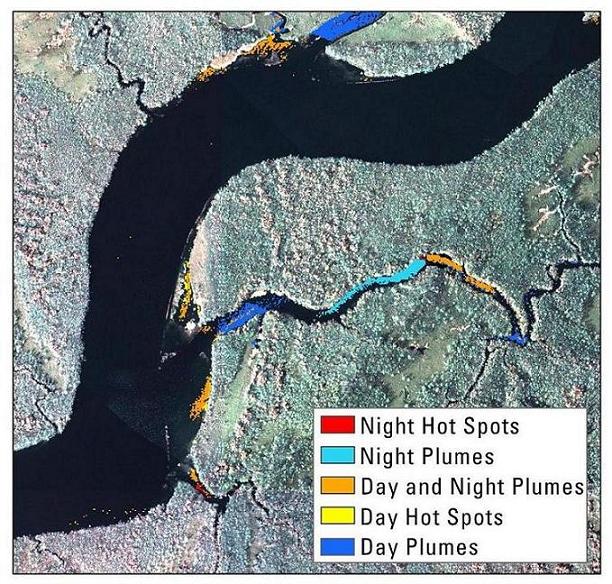
This directory contains the features derived from TIR as five separate georeferenced raster files. To access the data from this DVD, download the files to your computer.
Derived Temperature Anomalies:
Night Hot Spots To view derived temperature anomalies in Arc Map follow these steps: [This is an example for “suw_am_hot.tif” layer, but all other layers can be treated the same way.] 1: Open Arc Map, 2: Add Suw_am_hot.tif layer, 3: Double click on suw_am_hot.tif in table of contents and go to PROPERTIES, 4: Go to SYMBOLOGY, change display to CLASSFIED, 5: Change color for zero to no color and change zero-ten to desired color 6: View layers simultaneously by loading the five images as layers in Arc Map and changing the display to ~30-50% transparency under properties for each image, 7:Use the values in parentheses for each layer: suw_am_hot.tif (value 10), suw_pm_hot.tif (values 20 and 70), suw_pm_plume.tif (value 30), suw_am_plume.tif (40), suw_ampm_warm.tif (value 50). |
 |