U.S. Geological Survey Open-File Report 2008-1206
Coastal Change Along the Shore of Northeastern South Carolina: The South Carolina Coastal Erosion Study
Return to: Title and Abstract » Table of Contents » Section 1 » Section 2 » Section 3 » Section 4 » Section 5 » Section 6 » Acknowledgments » References » List of Figures » Acronymns » Glossary |
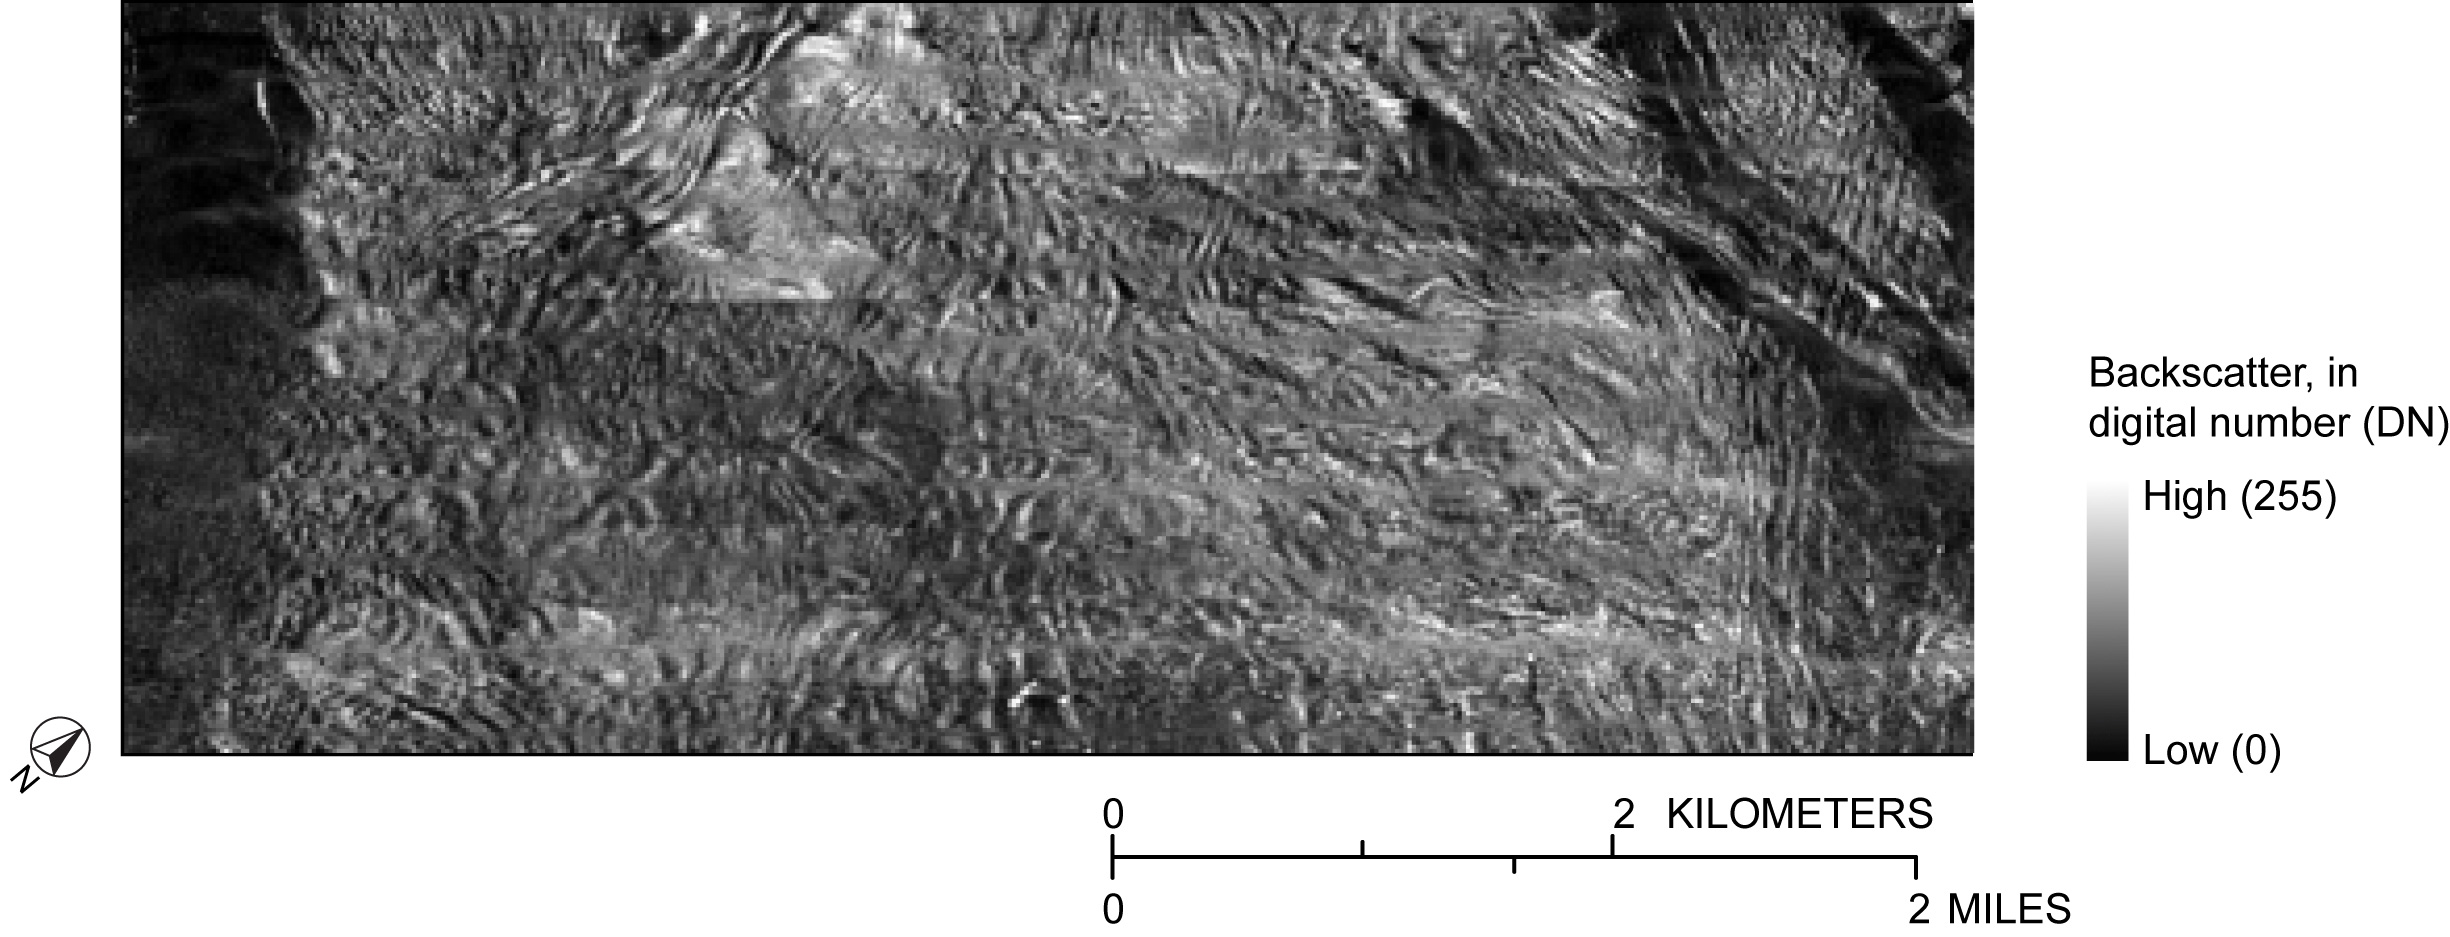
Figure 2.5. Enlarged section of the sidescan-sonar image in Figure 2.4 shows the complexities of the shallow seafloor offshore of Myrtle Beach. Intricate patterns of high backscatter (light tones) and low backscatter (dark tones) represent exposures of rock and fine sand deposits, respectively. Backscatter values are represented as digital numbers assigned to the pixels within the imagery, ranging from 0 (black) to 255 (white). See Figure 2.4 for location. [Click here for high-resolution image.] |
 |

 U.S. Department of the Interior |
U.S. Geological Survey
U.S. Department of the Interior |
U.S. Geological Survey
[an error occurred while processing this directive]
URL: https://pubsdata.usgs.gov
Page Contact Information: Publishing Service Center
Page Last Modified: Wednesday, 07-Dec-2016 21:39:21 EST
