U.S. Geological Survey Open-File Report 2008-1206
Coastal Change Along the Shore of Northeastern South Carolina: The South Carolina Coastal Erosion Study
Return to: Title and Abstract » Table of Contents » Section 1 » Section 2 » Section 3 » Section 4 » Section 5 » Section 6 » Acknowledgments » References » List of Figures » Acronymns » Glossary |
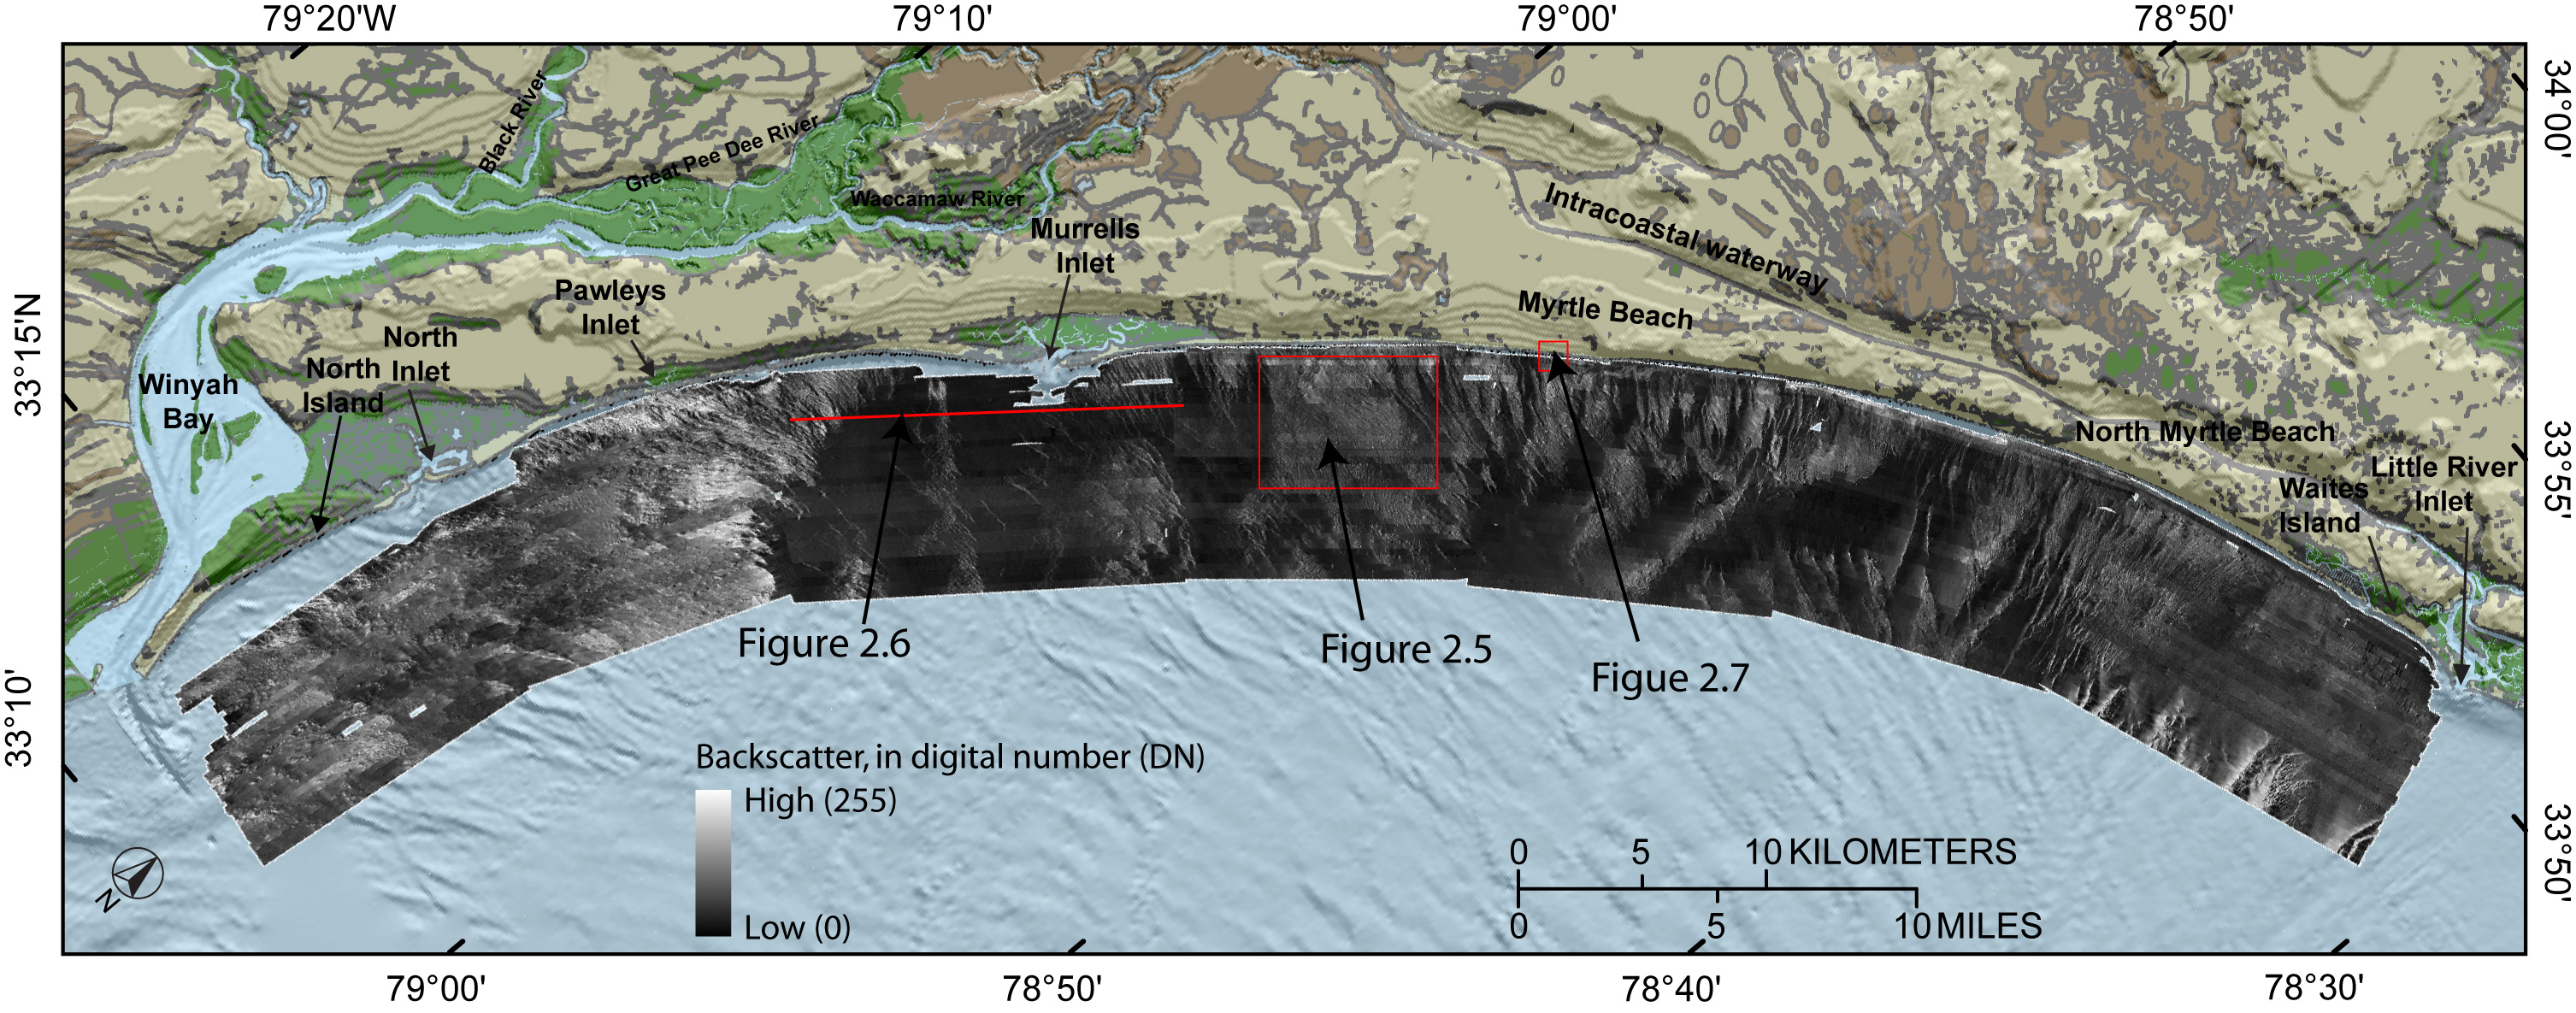
Figure 2.4. Map showing acoustic backscatter intensity, as measured with sidescan sonar, on the shallow seafloor of Long Bay. Backscatter intensity is a measure of the hardness and roughness of the seafloor. In general, higher values (light tones) represent rock, coarse sand, and gravel. Lower values (dark tones) generally represent fine sand and muddy sediment. Backscatter values are represented as digital numbers assigned to the pixels within the imagery, ranging from 0 (black) to 255 (white). Backscatter data are combined with laboratory analysis of sediment samples to interpret the surficial geology of the seafloor. Locations for Figures 2.5, 2.6, and 2.7 are displayed. [Click here for high-resolution image.] |
 |

 U.S. Department of the Interior |
U.S. Geological Survey
U.S. Department of the Interior |
U.S. Geological Survey
[an error occurred while processing this directive]
URL: https://pubsdata.usgs.gov
Page Contact Information: Publishing Service Center
Page Last Modified: Wednesday, 07-Dec-2016 21:39:21 EST
