U.S. Geological Survey Open-File Report 2008-1206
Coastal Change Along the Shore of Northeastern South Carolina: The South Carolina Coastal Erosion Study
Return to: Title and Abstract » Table of Contents » Section 1 » Section 2 » Section 3 » Section 4 » Section 5 » Section 6 » Acknowledgments » References » List of Figures » Acronymns » Glossary |
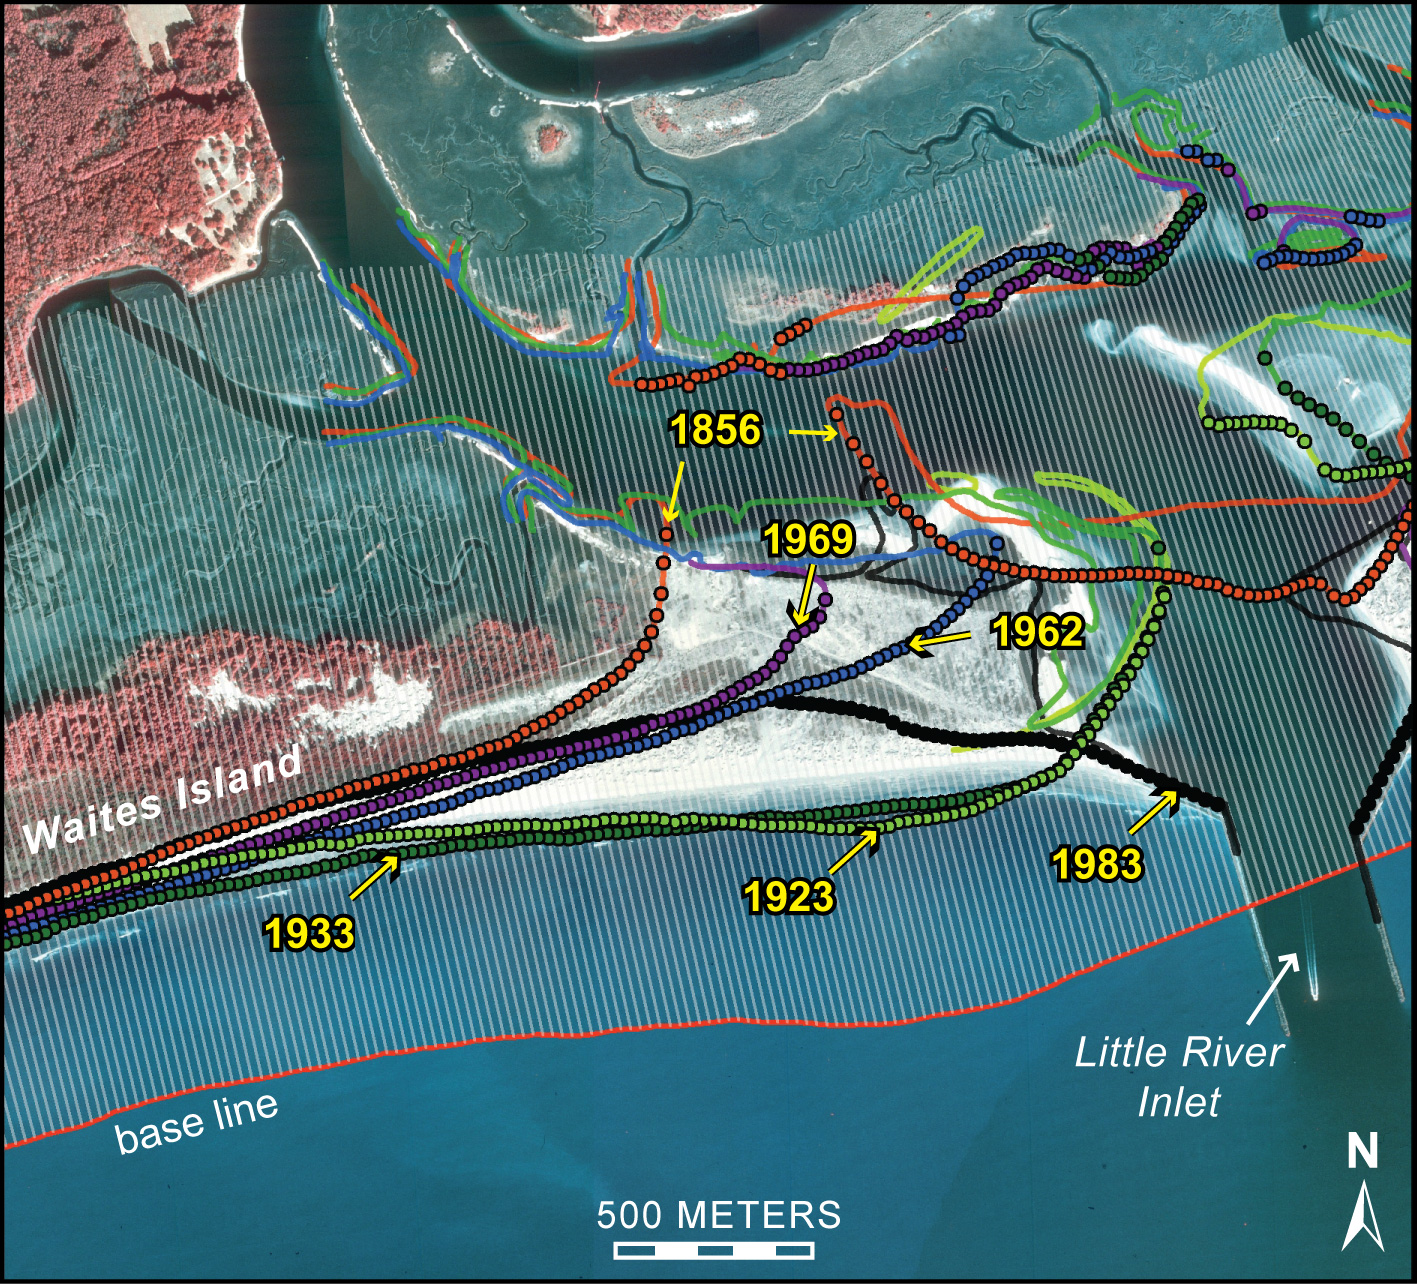
Figure 4.1. Aerial photograph showing historical shorelines from 1856 to 1983 around Waites Island and Little River Inlet. Shore-normal transects (gray lines) starting at a baseline 500 m offshore (red line) and extending inland for 2000 m, were drawn every 25 m along the coast. Where a transect intersected a former shoreline position (colored dots), the distance from the baseline was used to calculate the average rate of shoreline change over that time period. See Figure 4.2 for location. [Click here for high-resolution image.] |
 |

 U.S. Department of the Interior |
U.S. Geological Survey
U.S. Department of the Interior |
U.S. Geological Survey
[an error occurred while processing this directive]
URL: https://pubsdata.usgs.gov
Page Contact Information: Publishing Service Center
Page Last Modified: Wednesday, 07-Dec-2016 21:39:29 EST
