U.S. Geological Survey Open-File Report 2008-1206
Coastal Change Along the Shore of Northeastern South Carolina: The South Carolina Coastal Erosion Study
Return to: Title and Abstract » Table of Contents » Section 1 » Section 2 » Section 3 » Section 4 » Section 5 » Section 6 » Acknowledgments » References » List of Figures » Acronymns » Glossary |
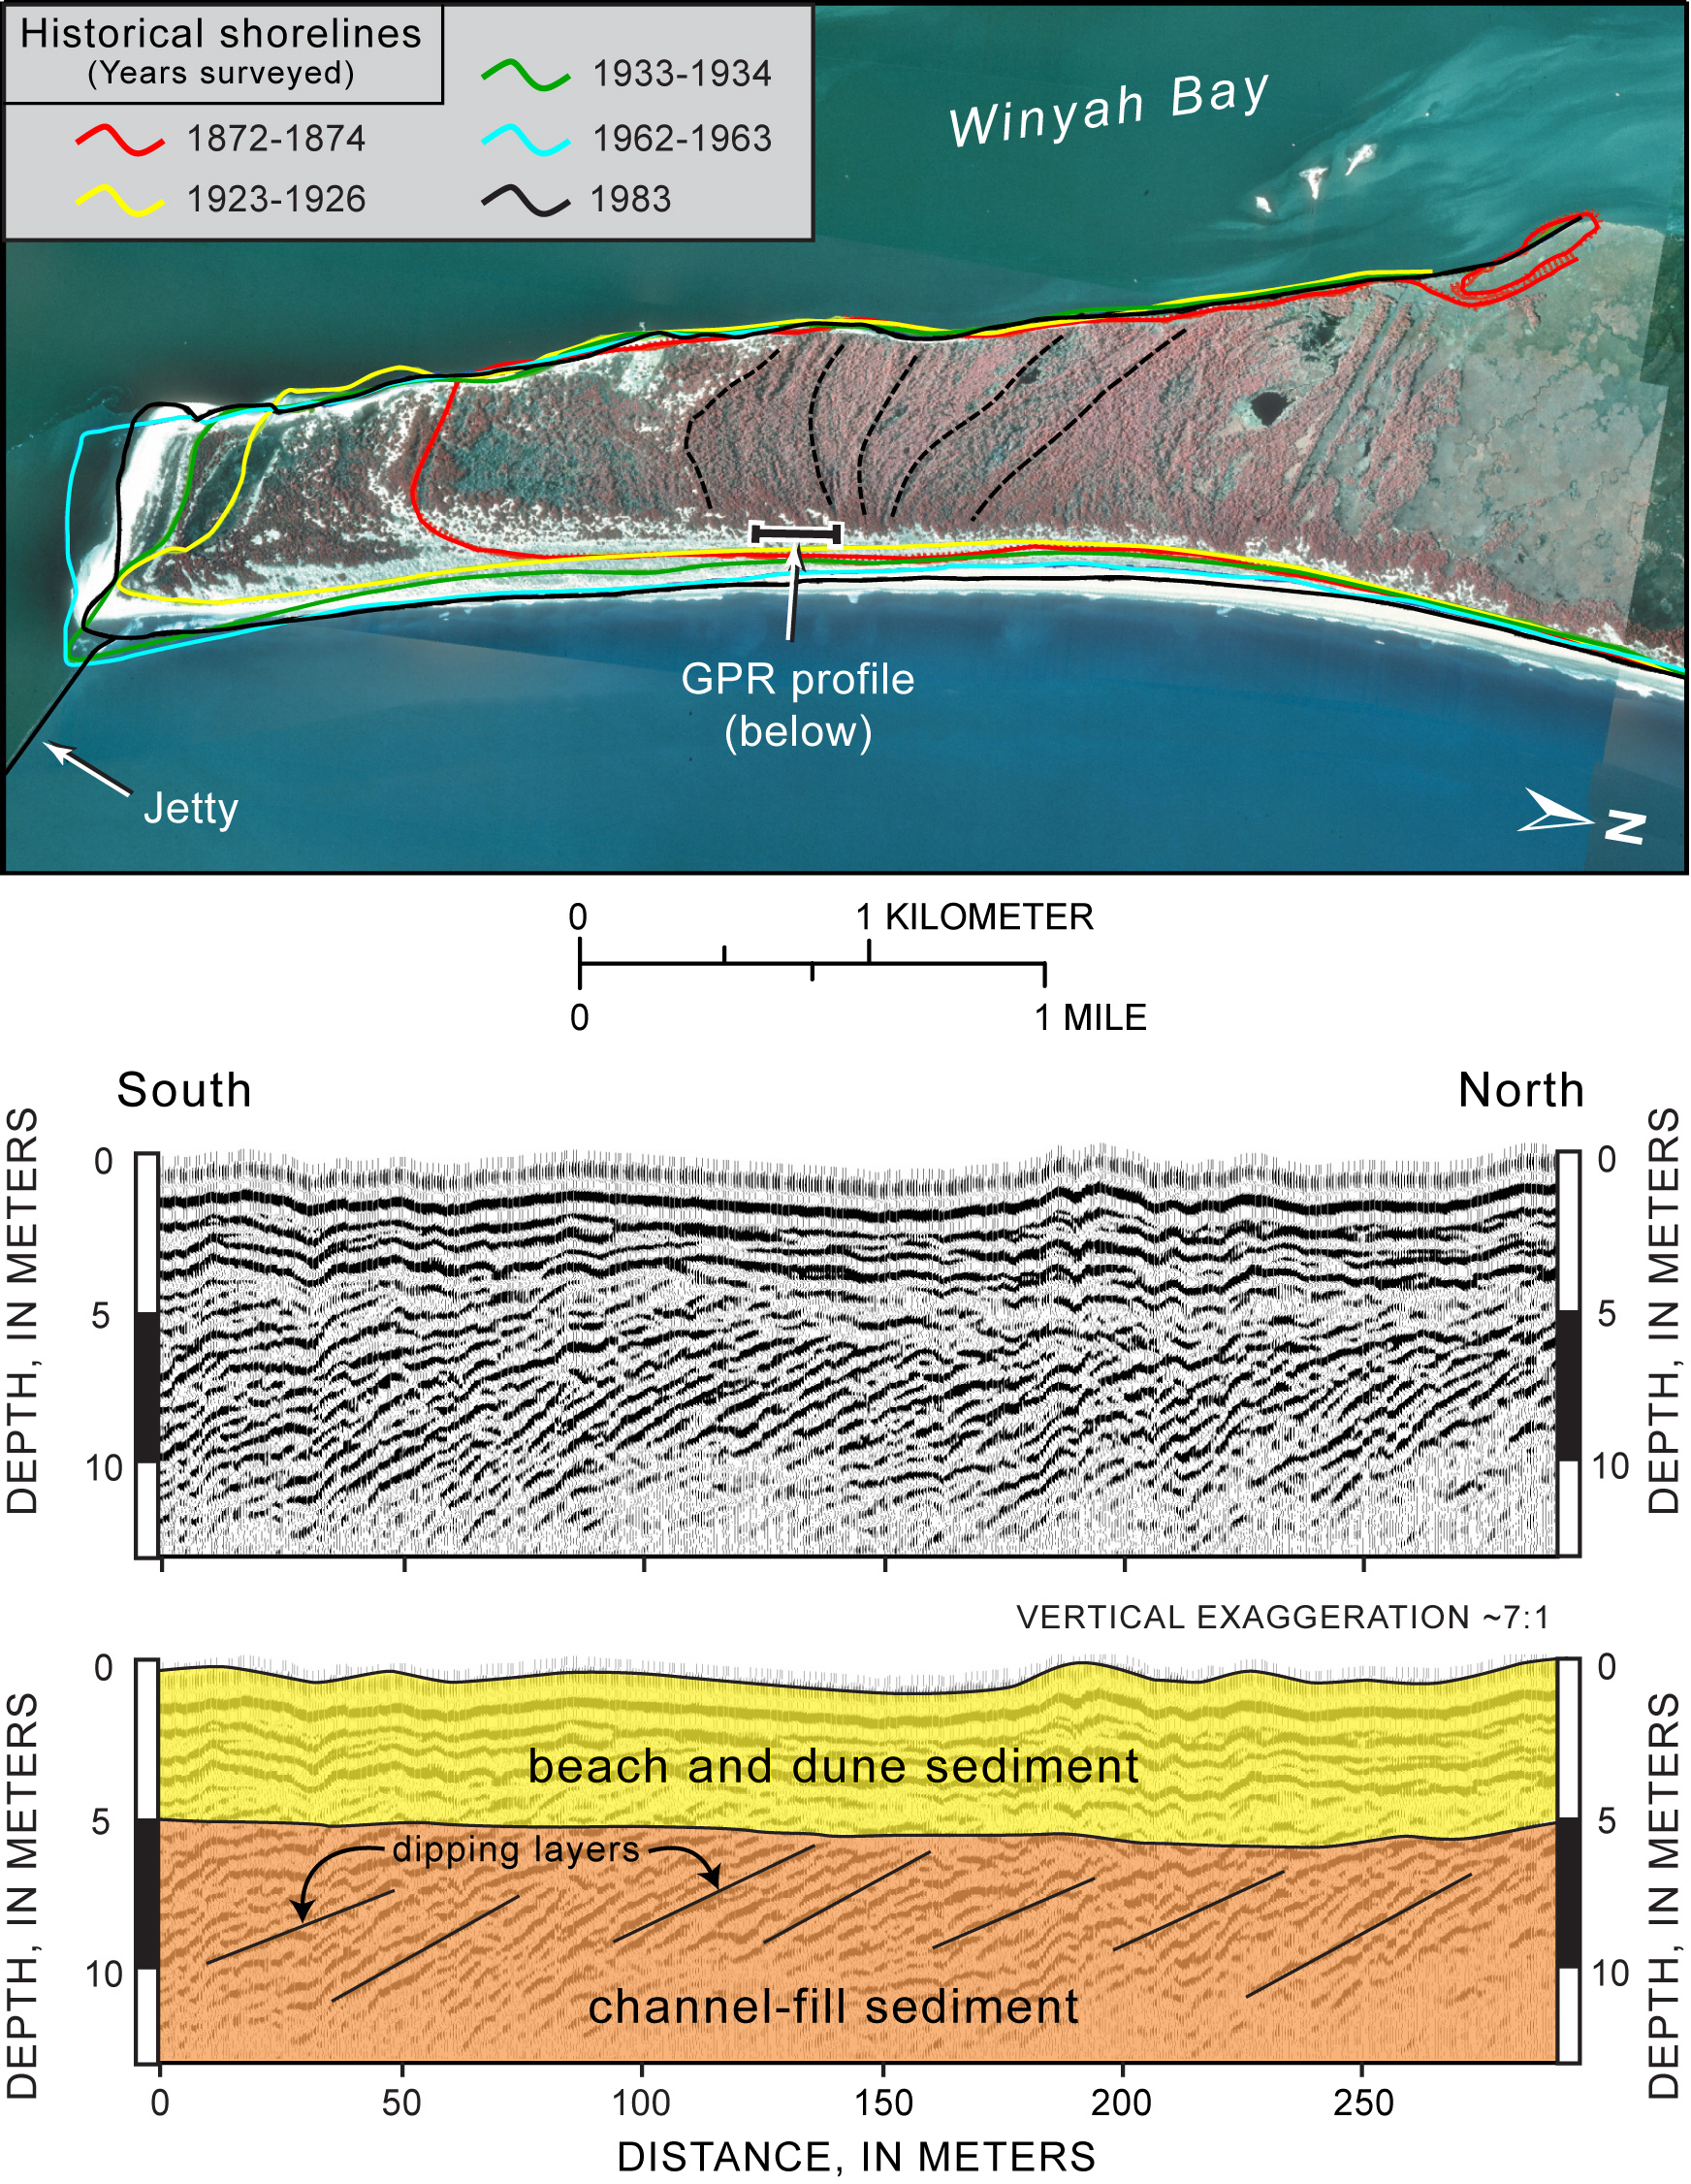
Figure 5.4. TOP: Aerial photograph of the North Island spit at the southern end of the Grand Strand, showing the positions of five historical shorelines. Prominent beach ridges (dashed lines) that predate the historical record were produced as the spit grew from north to south. BOTTOM: Ground-penetrating radar profile showing the internal structure of the spit, which consists of sandy sediment over 10 m thick. Steeply dipping layers in the lower unit (orange) formed as sediment, carried by south-directed longshore currents, filled the channel at the entrance to Winyah Bay. Beaches and dunes later developed on top of the channel-fill sediment, producing an upper deposit of fine sand (yellow) that exhibits wavy, nearly flat-lying layers. The calculation of sediment volume stored in the spit from 1872–1983 (see Table 5.1) is based on the prograding upper unit and underlying channel fill. ~, about. [Click here for high-resolution image.]
 |

 U.S. Department of the Interior |
U.S. Geological Survey
U.S. Department of the Interior |
U.S. Geological Survey
[an error occurred while processing this directive]
URL: https://pubsdata.usgs.gov
Page Contact Information: Publishing Service Center
Page Last Modified: Wednesday, 07-Dec-2016 21:39:34 EST
