U.S. Geological Survey Open-File Report 2008-1206
Coastal Change Along the Shore of Northeastern South Carolina: The South Carolina Coastal Erosion Study
Return to: Title and Abstract » Table of Contents » Section 1 » Section 2 » Section 3 » Section 4 » Section 5 » Section 6 » Acknowledgments » References » List of Figures » Acronymns » Glossary |
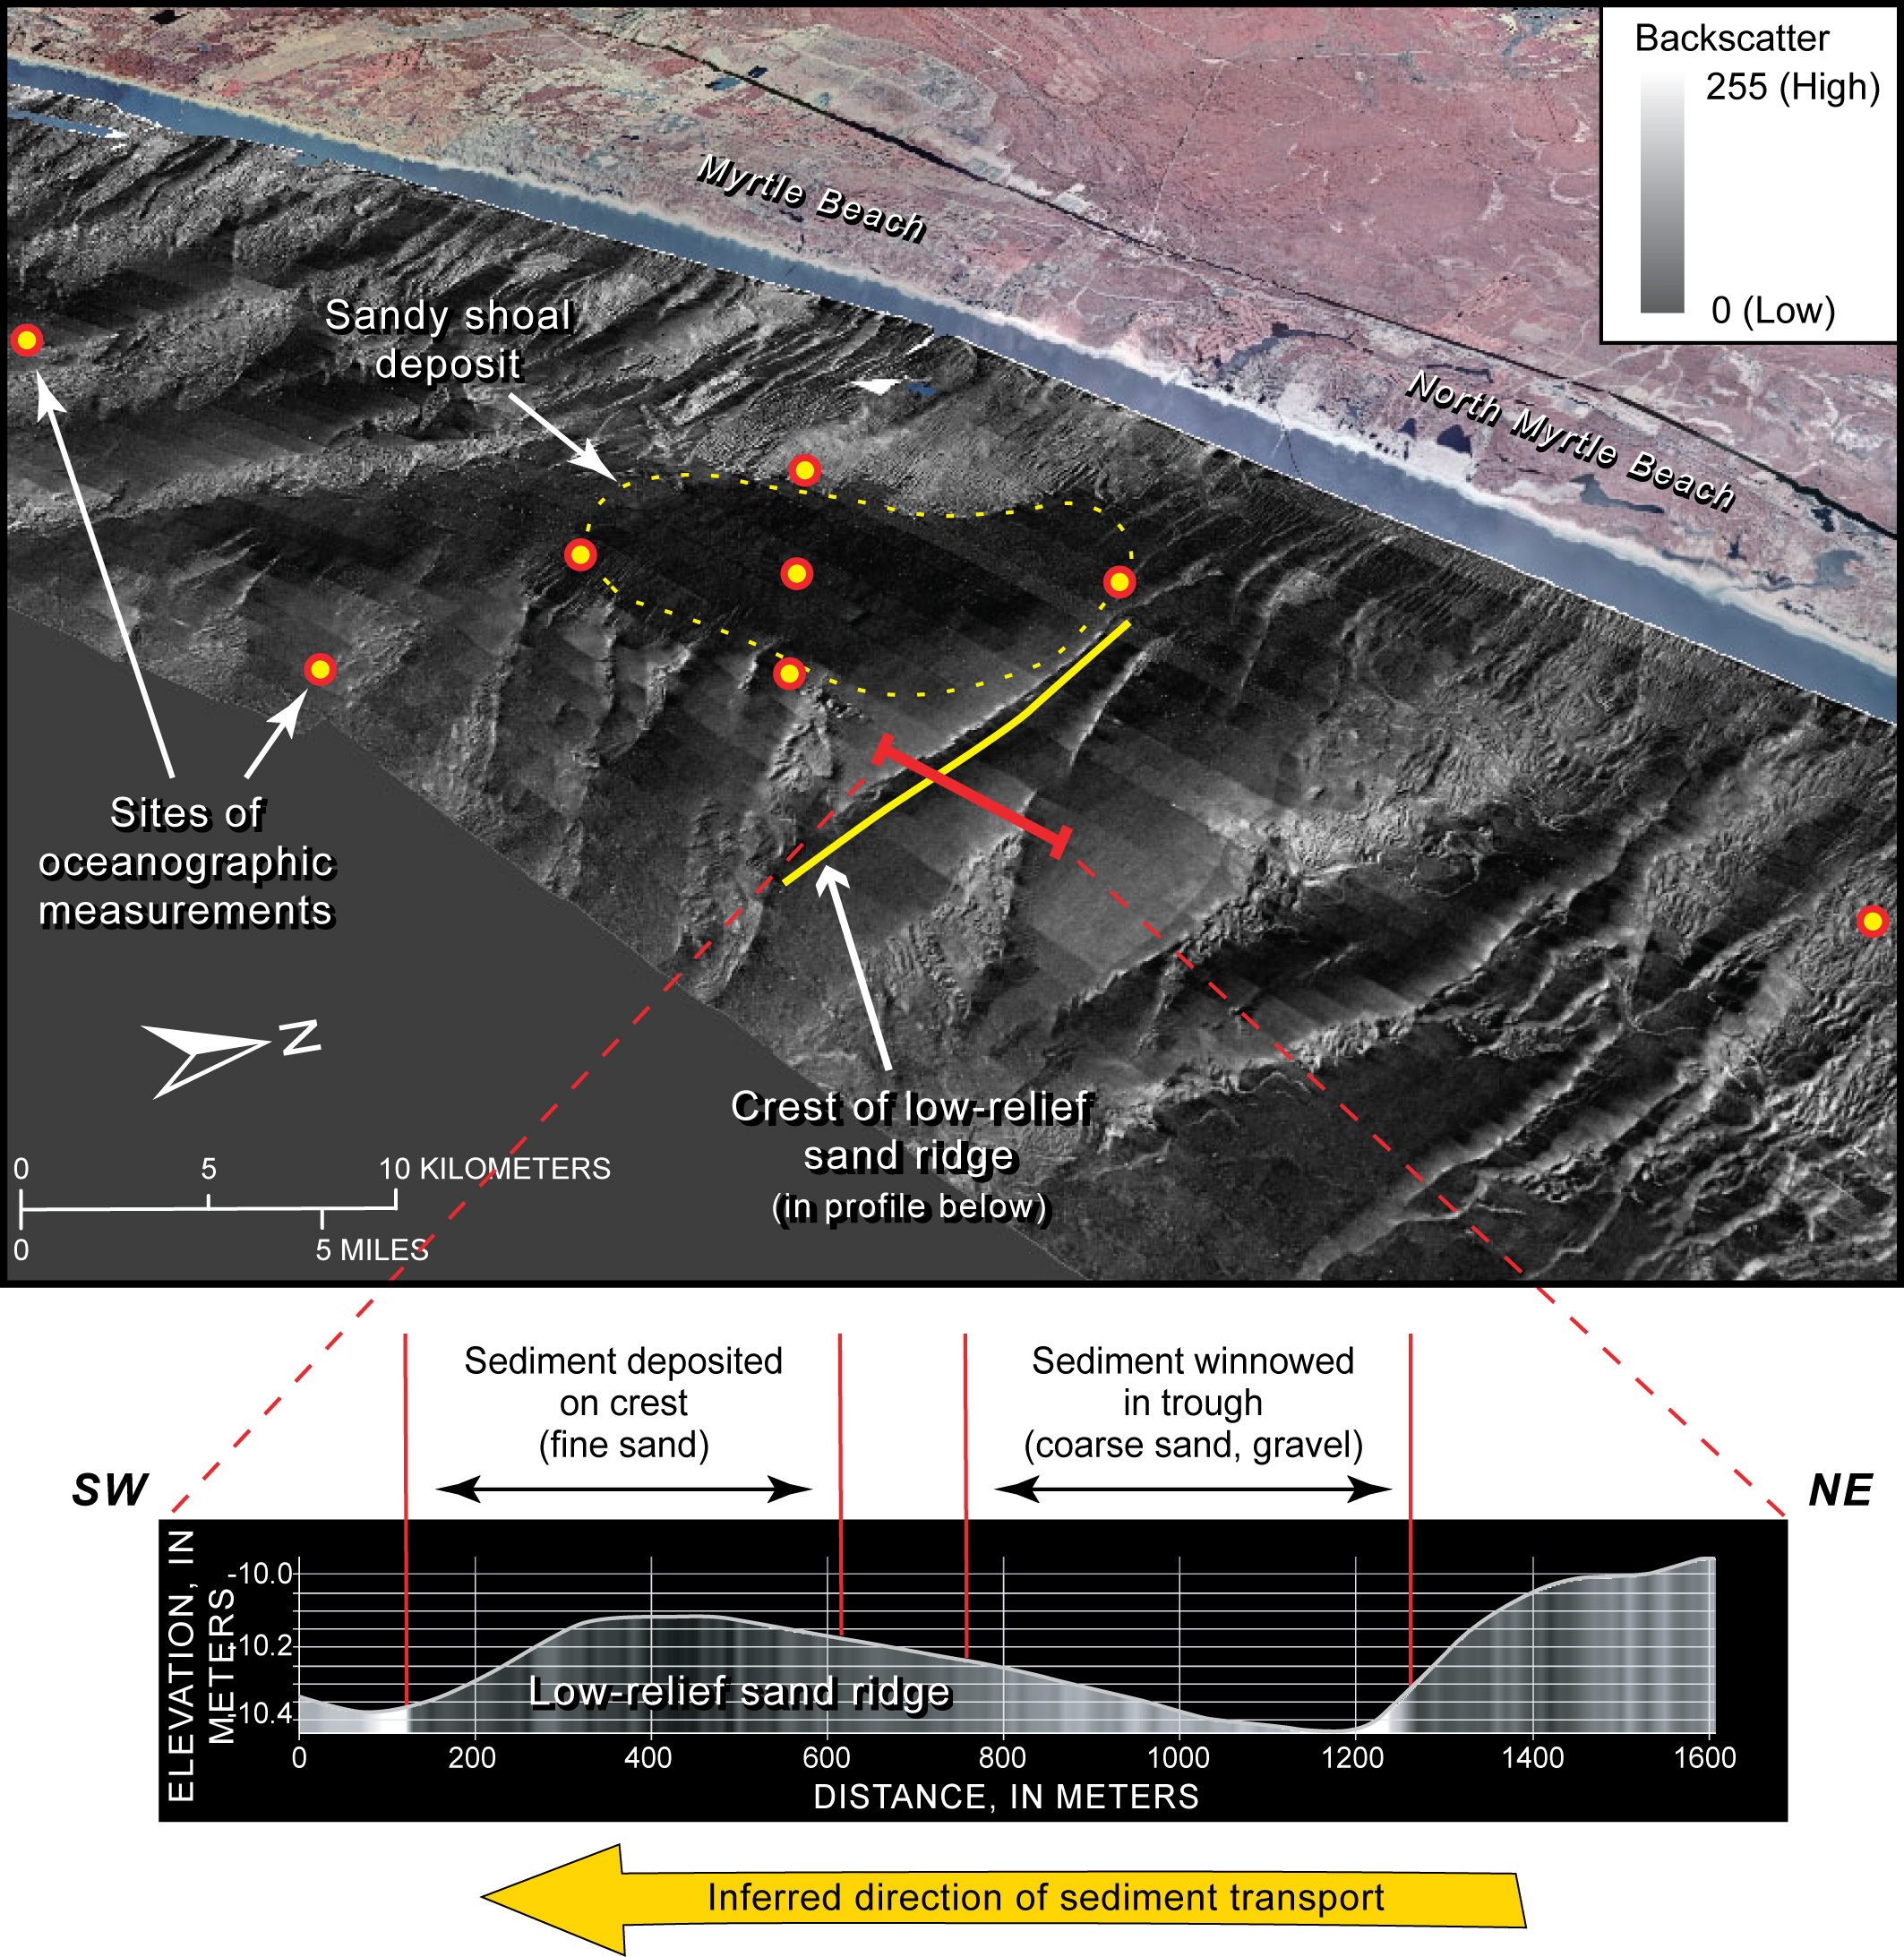
Figure 5.5. (TOP) Perspective view of the inner shelf offshore of Myrtle Beach showing sidescan-sonar imagery draped over bathymetry. High backscatter values (light tones) generally represent rock, gravel or coarse sand. Low backscatter values (dark tones) generally represent fine sand or muddy sediment. Oceanographic instruments were deployed at eight sites (red circles) on and near a large sandy shoal to determine the physical processes that control sediment transport around the feature. (BOTTOM) Bathymetric profile across a low-relief sand ridge. The steeper slope faces toward the southwest, indicating the direction of net sediment transport. Finer sediment has been winnowed from the trough and northeast-facing side of the ridge, leaving a lag of coarse sand and gravel. Fine sand has been deposited on the crest and southwest-facing side. Modified from Denny and others (2006). [Click here for high-resolution image.]
 |

 U.S. Department of the Interior |
U.S. Geological Survey
U.S. Department of the Interior |
U.S. Geological Survey
URL: https://pubsdata.usgs.gov/pubs/of/2008/1206/html/figs/fig5_5.html
Page Contact Information: Publishing Service Center
Page Last Modified: Monday, 03-Jun-2019 11:36:36 EDT
