U.S. Geological Survey Open-File Report 2009-1100, version 1.1
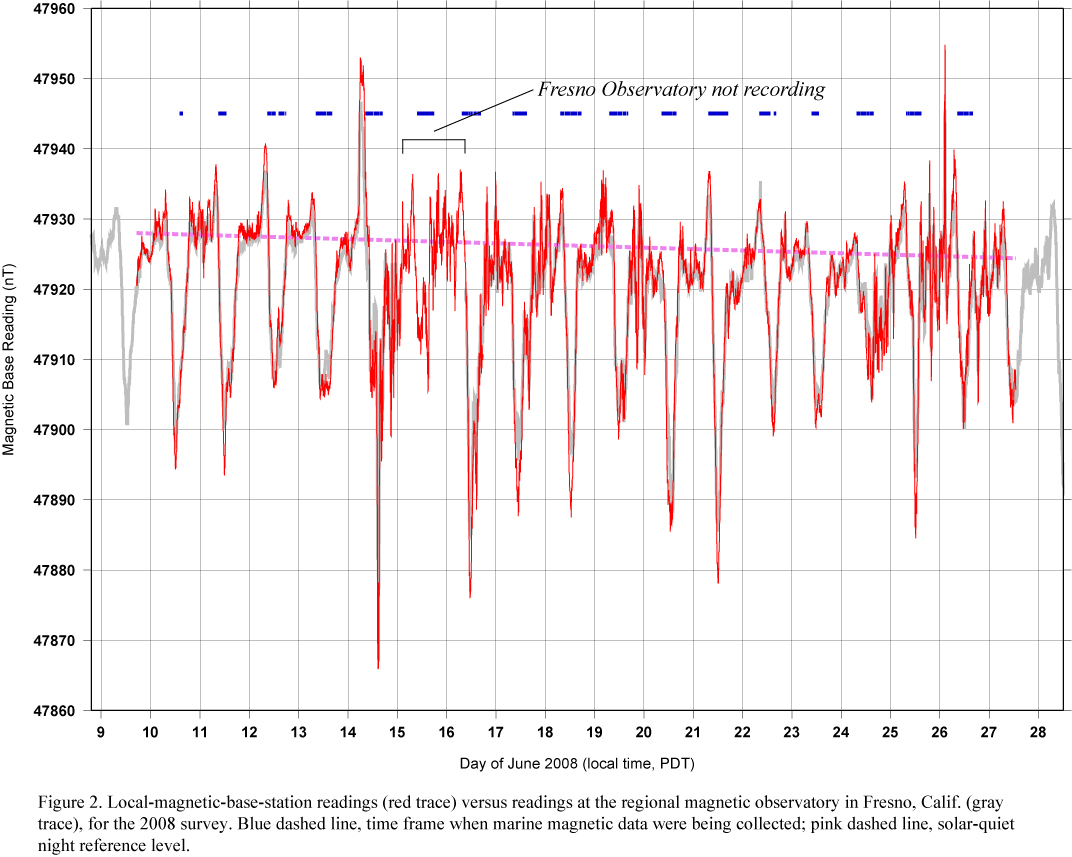
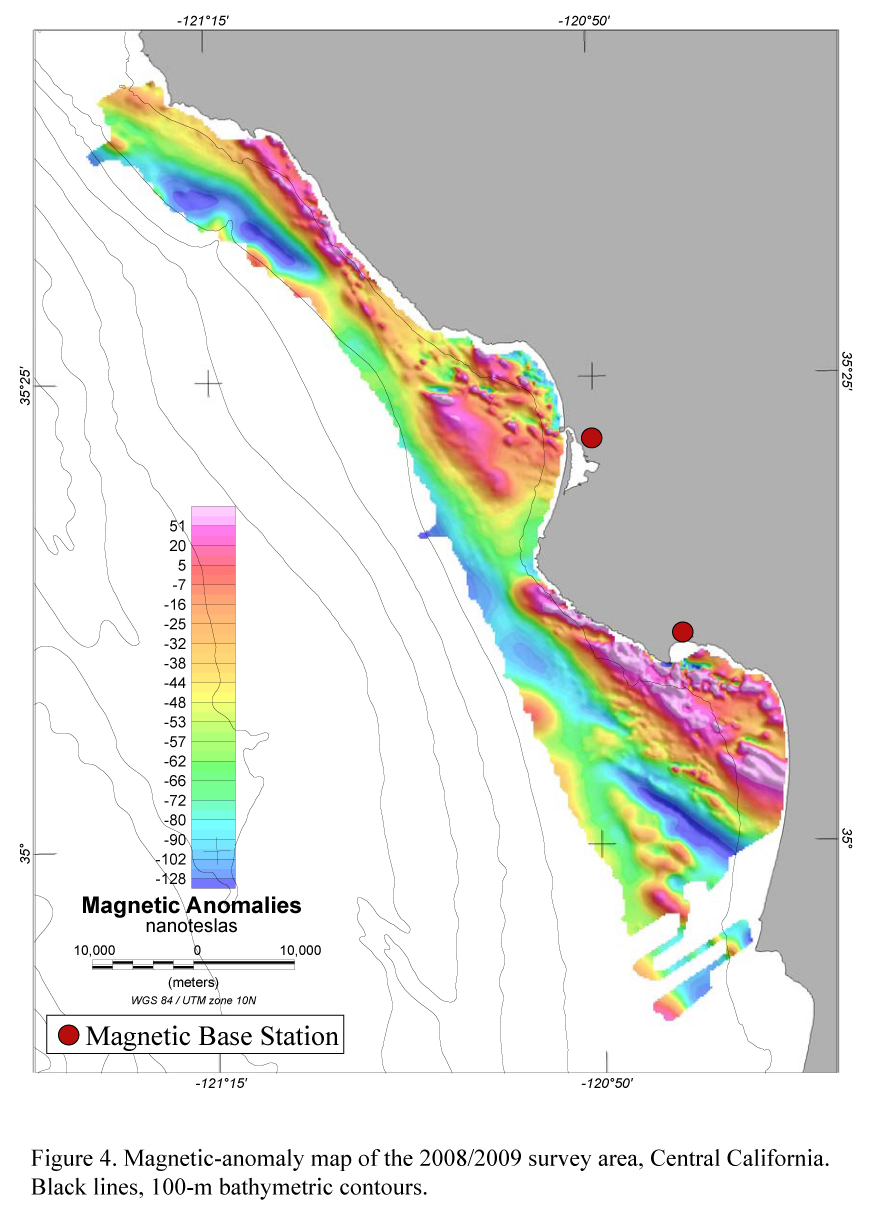
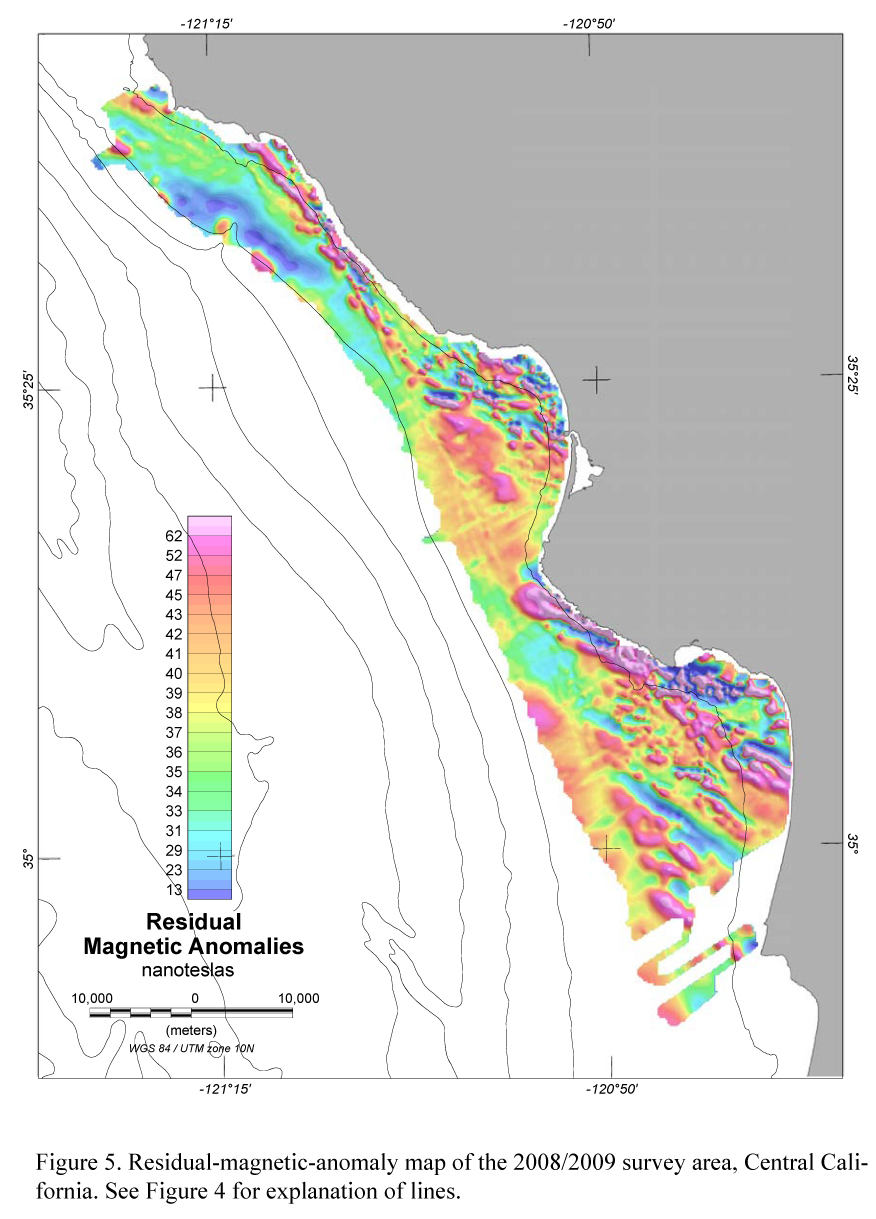
High-Resolution Seismic-Reflection and Marine Magnetic Data Along the Hosgri Fault Zone, Central CaliforniaData Acquisition And ProcessingMagnetic DataMarine magnetic data were collected using the Geometrics G882 cesium vapor magnetometer. The magnetometer was towed approximately 30 m behind the vessel in 2008 and approximately 50 m behind the vessel in 2009. The tow distance was increased in 2009 to reduce noise effects from the mini-sparker. Magnetic data were collected at a 10 Hz sample rate along shore-perpendicular transects simultaneously with the mini-sparker seismic-reflection data at a line spacing of 800 m. Additional magnetic transects were run in between seismic lines, resulting in a uniform line spacing of 400 m for the magnetic data. Magnetic and seismic-reflection data also were collected along a number of shore-parallel tie lines (see survey map). During the 2008 survey, a magnetic base station was set up onshore in Morro Bay State Park on the south flank of Black Hill (lat 35.3536° N., long 120.8314° W.) to measure the local magnetic field continuously in order to remove diurnal field variations from the offshore survey. In 2009 two magnetic base stations were set up onshore during different portions of the survey, one in Morro Bay State Park and one near Avila, Calif., in Wild Cherry Canyon (lat 35.1870° N, long 120.7467° W). Base station readings were recorded every minute using a Geometrics G856 proton precession magnetometer. Figure 2 and Figure 3 illustrate the importance of operating a local magnetic base station, as opposed to relying on data from a regional magnetic observatory. The regional magnetic observatory in Fresno (http://www.intermagnet.org/apps/dl_data_prel_e.php) not only failed to record data during a 28-hour period during the 2008 survey, but also did not capture the maximum amplitude of the diurnal variation in the Morro Bay area during either the 2008 or 2009 surveys. Initial processing of the magnetic data involved smoothing, mainly to remove noise from the mini-sparker source. The data smoothing resulted in approximate along-track data spacings of 10 m for lines where seismic-reflection data also were collected (boat speed 4 kts) and 25 m along the magnetometer-only lines (boat speed 10 kt). Further processing included removal of the diurnal field variation by using the magnetic base-station readings and subtraction of the reference field defined by the DGRF2005. Data were imported into Geosoft Oasis montaj™ geophysical software package where survey lines were leveled using the tie lines and then gridded (200 m) using minimum curvature (Briggs, 1974; Figure 4). In addition, the marine magnetic data were subtracted from the recently collected aeromagnetic data (Langenheim and others, 2009), resulting in a residual-magnetic-anomaly map of the shallow subsurface (<500 m below the sea floor, Figure 5). The aeromagnetic data were collected at a nominal flightline elevation of 300 m over the water, with a flight-track spacing of 800 m and a flightline orientation parallel to the offshore marine magnetic data. Seismic-Reflection DataSingle-channel seismic-reflection data for this survey were acquired along shore-perpendicular transects spaced 800 m apart, extending beyond the 3-mi limit of California State waters, using a SIG 2Mille minisparker and an Edgetech SB-0512i chirp system. Water depths in the survey area ranged from 6 m near shore to 210 m at the northwest corner of the survey area. The Edgetech 512 chirp subbottom-profiling system consisted of a source transducer and an array of receiving hydrophones housed in a 500-lb fish towed at a depth of several meters below the sea surface. The swept-frequency "chirp" source signal was 500 to 7,200 Hz with a 30-ms sweep length recorded by hydrophones located on the bottom of the fish. The SIG minisparker system used a 500-J high-voltage electrical discharge that created a source with greater power and lower frequency than the chirp and was received by a towed 15-m-long hydrophone streamer. The minisparker source was fired at a rate of 2 times per second, which, at normal survey speeds of 4 to 4.5 kts, gave a data trace every 1 m. Record lengths were 0.35 s for the chirp and 0.5 s for the minisparker. The data from each system were recorded digitally in standard SEG-Y 32-bit floating-point format with Triton Subbottom Logger (SBL) PC-based software that merged seismic-reflection data with differential GPS navigation data. Digital sampling was 12.5 kHz for the chirp data and 16 kHz for the minisparker data. Differential GPS position fixes were written into the trace headers of the SEG-Y files and are also available as an ASCII text file. All the lines that were collected with the chirp system are indicated by the prefix “PBC”, and minisparker lines begin with the prefix “PBS”. During initial deployment, the chirp system was unable to image deeper than 10 m subbottom depth, and it was quickly abandoned in favor of the lower-frequency minisparker system, which was able to penetrate as deep as 150 m. Subsequently, only four chirp lines were collected, and in the rest of the survey we used the minisparker sound source. After the survey, all the SEG-Y files were read by using Seismic Unix software, and PostScript (PS)-format image files of all the profiles were generated. A short-window (30 ms) automatic-gain-control (AGC) algorithm was applied to both the chirp and minisparker data, and a 160- to 1,200-Hz bandpass filter was applied to the minisparker data. These data-processing steps were applied only for display purposes and have not been applied to the available SEG-Y data. The PS-format image files were converted to TIFF- and smaller JPEG-format image files. All of the SEG-Y data files, the navigation file, and the TIFF- and JPEG-format image files are available for download from the Data Tables section of this report. |
|
|
For more information, contact the WCMG team.
|

![]() U.S. Department of the Interior |
U.S. Geological Survey
U.S. Department of the Interior |
U.S. Geological Survey
URL: https://pubs.usgs.gov/of/2009/1100/data_acquisition_and_processing.html
Page Contact Information: Michael Diggles
Page Last Modified: 9 September 2010 (mfd)
