Skip past header information
USGS - science for a changing world
CZM logo with link to CZM home page

U.S. Geological Survey Open-File Report 2010-1006

Geophysical and Sampling Data from the Inner Continental Shelf: Northern Cape Cod Bay, Massachusetts


Skip past contents information Title Page / Contents / List of Figures / Conversion Factors / Abstract / Introduction / Data Collection/Processing / Acknowledgments / References Cited / Appendix 1 / Appendix 2 / Appendix 3


Figure 4, a map showing the bathymetry of the study area.


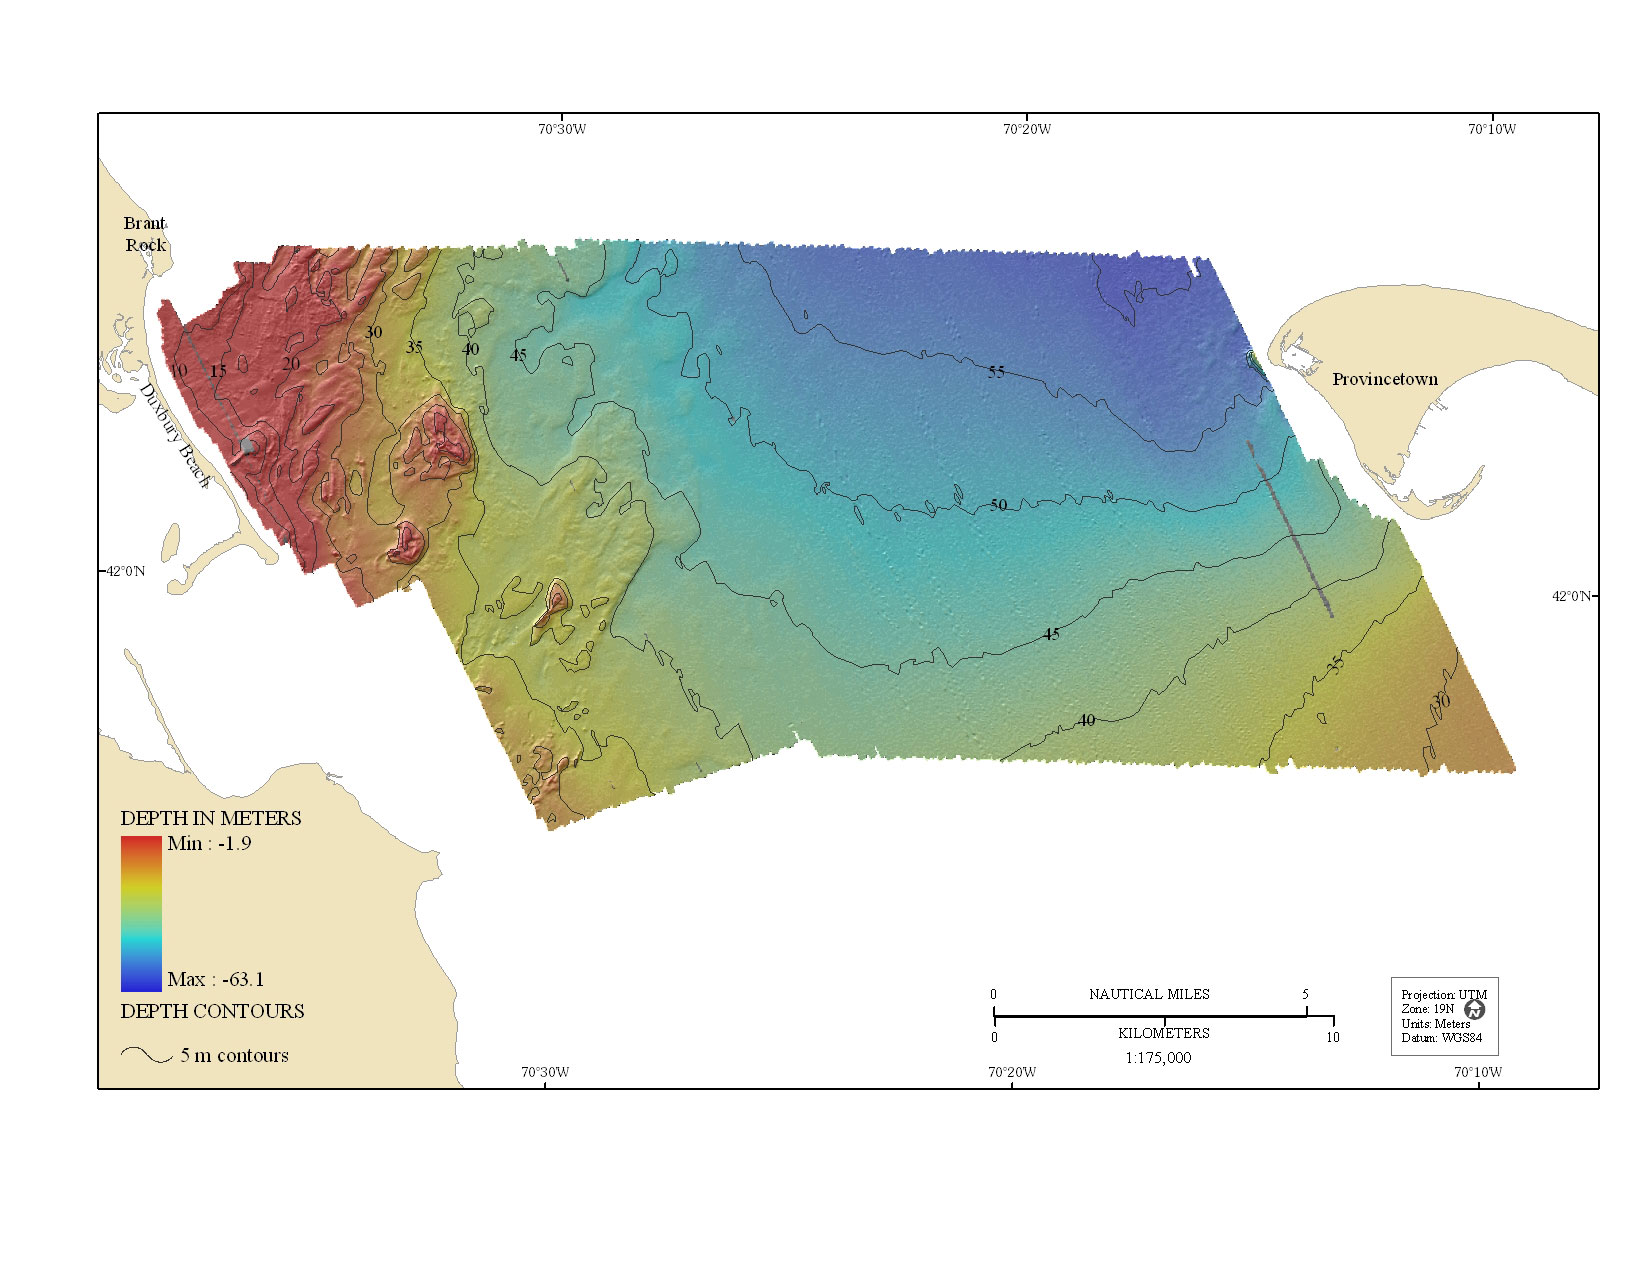
Figure 4.  Map showing shaded-relief bathymetry of the seafloor in northern Cape Cod Bay. Coloring and bathymetric contours represent depths in meters, relative to the Mean Lower Low Water (MLLW) datum. Areas shown in gray hillshade indicate gaps in the bathymetric coverage that were filled during post-processing using interpolation.

Skip USGS links group

Accessibility FOIA Privacy Policies and Notices

Take Pride in America logo USAGov logo U.S. Department of the Interior | U.S. Geological Survey
End of USGS links group