U.S. Geological Survey, 2010, Comma-Separated Value files of the raw sound velocity profiles and JPEG images displaying charts of the sound velocity profiles collected by the U.S. Geological Survey in the St. Clair River between Michigan and Ontario, Canada, 2008 (CSV and JPEG Files): Open-File Report 2010-1035, U.S. Geological Survey, Coastal and Marine Geology Program, Woods Hole Coastal and Marine Science Center, Woods Hole, MA.This is part of the following larger work.Online Links:
- <https://pubs.usgs.gov/of/2010/1035/gis_catalog/bathymetry/svp/cast.zip>
- <https://pubs.usgs.gov/of/2010/1035/html/gis.html>
Denny, Jane F. , Foster, David S. , Worley, Charles R. , and Irwin, Barry J. , 2010, Geophysical data collected from the St. Clair River between Michigan and Ontario, Canada, 2008-016-FA: Open-File Report 2010-1035, U.S. Geological Survey, Woods Hole Coastal and Marine Science Center.Online Links:
The following is a description of file contents:
Line 1: Sequential station number of the sound velocity profile (e.g. cast 1) Line 2: Description of the system used (e.g. SV plus) Line 3: Identification of the columns (Time (M/D/YYYY), Pressure (meters), Temperature (Celsius), Sound Velocity (meters/second), Battery (volts); Line 4: contains the units associated with line 3 (with the first column of information blank).
The remainder of the text file lists the actual sound velocity profile data. Example:
5/29/2008 1:01:21 PM,1443.60, -0.20, 13.428, 13.4
508-548-8700 x2311 (voice)
508-457-2310 (FAX)
jdenny@usgs.gov
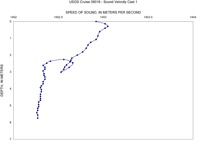
Comma delimited text files contain the raw sound velocity profiles collected during USGS Cruise 08016 in the St. Clair River between Michigan and Ontario, Canada, 2008. These data are supplied to provide the raw profile data used to minimize refraction artifacts within the swath bathymetric data. The sound velocity profiles are also saved as charts in JPEG format and supplied to provide a graphic view of the sound velocity profiles.These data are also available within a separate WinZip archive (<https://pubs.usgs.gov/of/2010/1035/gis_catalog/bathymetry/svp/svp_csv.zip>).
U.S. Geological Survey.
Swath-bathymetric and acoustic-backscatter data were acquired with a SEA, Ltd., SWATHplus interferometric sonar operating at a 234-kHz frequency (<http://www.sea.co.uk/swathplus.aspx?nav=products>). The SWATHplus transducer was mounted at the bow of the USGS R/V Rafael. Bathymetric data were acquired over variable swath widths ranging from 10 to 100 m, in water depths of about 1 to 25 m. A total of 109 km of swath bathymetric data were collected.
SWATHplus acquisition software (version 3.05.90) was used to digitally log the bathymetric data at a rate of 30 pings/second and 3,072 samples per swath (ping) in the SWATHplus SXR format. Data collection parameters are saved into a SWATHplus session file in SEA's SXS format. These files that can be later used for data replay.
An Octopus F180R Attitude and Positioning system (see: <http://www.codaoctopus.com/motion/f180/index.asp>) recorded ship motion (heave, pitch, roll, and yaw). These data were transmitted via network connection to the SWATHplus data collection software. The Octopus F180R Inertial Measurement Unit (IMU) was mounted directly above the SWATHplus transducers, to minimize lever arm offsets that can lead to positioning errors. The F180R uses two L1 antennas for position and heading accuracy. The antennas are mounted on a rigid horizontal pole, 3 meters above the F180R IMU, with a horizontal separation of 1 meter and are offset from the IMU in a forward/aft configuration. The forward offset of the primary antenna from the IMU is 0.5 meters, with no port/starboard offset.
Eight sound-velocity profiles were acquired during survey operations at roughly 4-hr intervals using an Applied Microsystems SV Plus V2 Velocimeter (<http://www.appliedmicrosystems.com/products/productDetails.aspx?id=1>)
At each station, the SV plus 2 was hand deployed and slowly lowered to the seafloor. The SV plus v2 was monitored by a member of the science party and as the instrument made contact with the seafloor, the position (i.e. location) was recorded in the lab using HYPACK navigation software. The position was then manually recorded within the cruise log and SWATHplus acquisition software. Upon recovery, the SV plus was connected to an onboard computer via serial port in order to download data using the SV plus v2 communications software, SmartTalk.
Software: SV plus v2 SmartTalk (no version)
Person who carried out this activity:
508-548-8700 x 2311 (voice)
508-457-2310 (FAX)
jdenny@usgs.gov
Software: Microsoft Excel 2004; Adobe Photoshop CS3 (10.0.1)
Person who carried out this activity:
(508) 548-8700x2311 (voice)
5084572310 (FAX)
jdenny@usgs.gov
Foster, David S. , and Denny, Jane F. , 2009, Quaternary Geologic Framework of the St. Clair River between Michigan and Ontario, Canada: Open-File Report 2009-1137, U.S. Geological Survey, Coastal and Marine Geology Program, Woods Hole Coastal and Marine Science Center.Online Links:
Differential Global Positioning System (DGPS) navigation data were acquired with a Communications Systems International (CSI), Inc. LGBX Pro receiver and recorded with HYPACK (www.hypack.com). The CSI LGBX Pro received positions from a DGPS antenna located on the port, aft roof of the R/V Rafael cabin. Ship location was used for the sound velocity deployments. The SV plus v2 sound velocity profiler was hand deployed. Once the system reached bottom, positions were read from HYPACK and stored. DGPS accuracy is 1 to 3 meters, depending on the distance from a US Coast Guard coastal repeater station (<http://www.navcen.uscg.gov/>). However, offsets from the location of hand-deployment and the DGPS antenna were not measured. Thus, the horizontal accuracy of the sound velocity locations is considered to be +/- 5 meters.
Water depth of the sound velocity profiles was extracted from the recorded sound velocity profile after recovery. Depth is recorded as the sound velocity profiler is lowered through the water column and downloaded after the instrument is recovered. Data are stored in ASCII text files.
All sound velocity profiles collected during USGS Cruise 08016 are included within the WinZip archive (<https://pubs.usgs.gov/of/2010/1035/gis_catalog/svp/cast.zip>
All sound velocity profiles were acquired with the same instrument during the course of USGS Cruise 08016; an Applied Microsystems SV plus v2.
Are there legal restrictions on access or use of the data?
- Access_Constraints: None
- Use_Constraints:
- Public domain data from the U.S. Government are freely redistributable with proper metadata and source attribution. Please recognize the U.S. Geological Survey as the originator of the dataset.
508-548-8700 x2311 (voice)
508-457-2310 (FAX)
jdenny@usgs.gov
Downloadable Data
Neither the U.S. Government, the Department of the Interior, nor the USGS, nor any of their employees, contractors, or subcontractors, make any warranty, express or implied, nor assume any legal liability or responsibility for the accuracy, completeness, or usefulness of any information, apparatus, product, or process disclosed, nor represent that its use would not infringe on privately owned rights. The act of distribution shall not constitute any such warranty, and no responsibility is assumed by the USGS in the use of these data or related materials.Any use of trade, product, or firm names is for descriptive purposes only and does not imply endorsement by the U.S. Government.
| Data format: | WinZip file containing comma-separated value files and JPEG files and associated metadata of the sound velocity profiles collected during USGS Cruise 08016 in format WinZip (version 9.0) Size: 1847 KB |
|---|---|
| Network links: |
htp://pubs.usgs.gov/of/2010/1035/gis_catalog/bathymetry/svp/cast.zip |
These data can be viewed with any software package able to read comma delimited text files and JPEG images.
508-548-8700 x 2311 (voice)
508-457-2310 (FAX)
jdenny@usgs.gov