DSUELEV: Elevation of the bedrock surface within the St. Clair River between Michigan and Ontario, Canada, 2008 (ESRI GRID)

Metadata also available as - [Outline] - [Parseable text]

Frequently-anticipated questions:


What does this data set describe?

Title:
DSUELEV: Elevation of the bedrock surface within the St. Clair River between Michigan and Ontario, Canada, 2008 (ESRI GRID)
Abstract:
In 2008, the U.S. Geological Survey (USGS), Woods Hole Coastal and Marine Science Center (WHCMSC), in cooperation with the U.S. Army Corps of Engineers conducted a geophysical and sampling survey of the riverbed of the Upper St. Clair River between Port Huron, MI, and Sarnia, Ontario, Canada. The objectives were to define the Quaternary geologic framework of the St. Clair River to evaluate the relationship between morphologic change of the riverbed and underlying stratigraphy. This report presents the geophysical and sample data collected from the St. Clair River, May 29-June 6, 2008 as part of the International Upper Great Lakes Study, a 5-year project funded by the International Joint Commission of the United States and Canada to examine whether physical changes in the St. Clair River are affecting water levels within the upper Great Lakes, to assess regulation plans for outflows from Lake Superior, and to examine the potential effect of climate change on the Great Lakes water levels ( <http://www.iugls.org>). This document makes available the data that were used in a separate report, U.S. Geological Survey Open-File Report 2009-1137, which detailed the interpretations of the Quaternary geologic framework of the region. This report includes a description of the suite of high-resolution acoustic and sediment-sampling systems that were used to map the morphology, surficial sediment distribution, and underlying geology of the Upper St. Clair River during USGS field activity 2008-016-FA . Video and photographs of the riverbed were also collected and are included in this data release. Future analyses will be focused on substrate erosion and its effects on river-channel morphology and geometry. Ultimately, the International Upper Great Lakes Study will attempt to determine where physical changes in the St. Clair River affect water flow and, subsequently, water levels in the Upper Great Lakes.will attempt to determine where physical changes in the St. Clair River affect water flow and, subsequently, water levels in the Upper Great Lakes.
  1. How should this data set be cited?

    U.S. Geological Survey, 2010, DSUELEV: Elevation of the bedrock surface within the St. Clair River between Michigan and Ontario, Canada, 2008 (ESRI GRID): Open-File Report 2010-1035, U.S. Geological Survey, Coastal and Marine Geology Program, Woods Hole Coastal and Marine Science Center, Woods Hole, MA.

    Online Links:

    This is part of the following larger work.

    Denny, Jane F. , Foster, David S. , Worley, Charles R. , and Irwin, Barry J. , 2010, Geophysical data collected from the St. Clair River between Michigan and Ontario, Canada, 2008-016-FA: Open-File Report 2010-1035, U.S. Geological Survey, Woods Hole Coastal and Marine Science Center.

    Online Links:

  2. What geographic area does the data set cover?

    West_Bounding_Coordinate: -82.429857
    East_Bounding_Coordinate: -82.399424
    North_Bounding_Coordinate: 43.018425
    South_Bounding_Coordinate: 42.952890

  3. What does it look like?

    <https://pubs.usgs.gov/of/2010/1035/gis_catalog/geology/dsuelev_sm.jpg> (JPEG)
    Thumbnail image of the elevation of bedrock surface within the St. Clair River

  4. Does the data set describe conditions during a particular time period?

    Beginning_Date: 31-May-2008
    Ending_Date: 01-Jun-2008
    Currentness_Reference: ground condition

  5. What is the general form of this data set?

    Geospatial_Data_Presentation_Form: raster digital data

  6. How does the data set represent geographic features?

    1. How are geographic features stored in the data set?

      This is a Raster data set. It contains the following raster data types:

      • Dimensions 362 x 118 x 1, type Grid Cell

    2. What coordinate system is used to represent geographic features?

      Grid_Coordinate_System_Name: Universal Transverse Mercator
      Universal_Transverse_Mercator:
      UTM_Zone_Number: 17
      Transverse_Mercator:
      Scale_Factor_at_Central_Meridian: 0.999600
      Longitude_of_Central_Meridian: -81.000000
      Latitude_of_Projection_Origin: 0.000000
      False_Easting: 500000.000000
      False_Northing: 0.000000

      Planar coordinates are encoded using row and column
      Abscissae (x-coordinates) are specified to the nearest 20.000000
      Ordinates (y-coordinates) are specified to the nearest 20.000000
      Planar coordinates are specified in meters

      The horizontal datum used is D_WGS_1984.
      The ellipsoid used is WGS_1984.
      The semi-major axis of the ellipsoid used is 6378137.000000.
      The flattening of the ellipsoid used is 1/298.257224.

      Vertical_Coordinate_System_Definition:
      Depth_System_Definition:
      Depth_Datum_Name: International Great Lakes Datum 1985 (IGLD 85)
      Depth_Resolution: 0.5
      Depth_Distance_Units: meters
      Depth_Encoding_Method: Attribute values

  7. How does the data set describe geographic features?


Who produced the data set?

  1. Who are the originators of the data set? (may include formal authors, digital compilers, and editors)

  2. Who also contributed to the data set?

  3. To whom should users address questions about the data?

    Jane Denny
    U.S. Geological Survey
    Geologist
    384 Woods Hole Road
    Woods Hole, MA 02543
    USA

    508-548-8700 x2311 (voice)
    508-457-2310 (FAX)
    jdenny@usgs.gov


Why was the data set created?

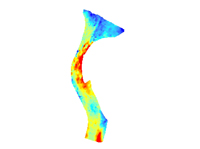
This data set contains a grid representing elevation of the bedrock surface within the St. Clair River between Michigan and Ontario. These data are used to assess the relation between geologic Framework and morphologic changes in the St. Clair River channel.


How was the data set created?

  1. From what previous works were the data drawn?

    (source 1 of 1)
    Source_Contribution:
    The seismic reflection profiling system utilized a Boomer energy source operated with a power output of 175 joules. The Boomer source was fired at 0.5 s intervals. A single-channel Benthos AQ4 streamer received the seismic reflection signal. The analog signal was band-pass filtered between 100 and 3000 Hz. A 23-db gain was applied. The analog signal was digitized and recorded in SEG-Y format using SonarWiz.MAP +SBP software version 4.03.0089. DGPS coordinates were recorded in the SEG-Y file trace headers as seconds of arc. The layback distance from the DGPS antenna to the source and receiver was visually estimated and applied to the position during acquisition. A total of 200 ms of data were acquired for each trace. A total of 58.5 km of Boomer profiles were collected.

  2. How were the data generated, processed, and modified?

    Date: 2008 (process 1 of 6)
    A Sioseis (<http://sioseis.ucsd.edu/>) script was executed to read the raw SEG-Y (Barry and others, 1975) files, apply a band-pass filter of 500 to 2000 Hz and Automatic Gain Control with a window length of 20 ms. Seismic Unix (version 4.1; Stockwell, 1975) was used to read the processed SEG-Y files, write a Seismic Unix file, and extract SEG-Y trace header information, which included shot number, longitude, latitude, year, filename, Julian day, and time of day (UTC). Latitude and longitude were converted from geographic coordinates (WGS84) to UTM zone 17 coordinates (WGS84) using Proj (version 4.6.0). The unique shot navigation for each seismic line was then concatenated into a comma delimited (.csv) text file.

    Sioseis 2008; Seismic Unix 4.1; Proj 4.6.0

    Person who carried out this activity:

    David S. Foster
    U.S. Geological Survey
    Geologist
    384 Woods Hole Road
    Woods Hole, MA 02543
    USA

    508-548-8700 x 2271 (voice)
    508-457-2310 (FAX)
    dfoster@usgs.gov

    Date: 2008 (process 2 of 6)
    The processed SEG-Y files were loaded into Geographix Discovery SeisVision seismic-interpretation software and associated to the unique shot point and UTM coordinates derived in process step 1.

    Geographix Discovery SeisVision R5000

    Person who carried out this activity:

    David S. Foster
    U.S. Geological Survey
    Geologist
    384 Woods Hole Road
    Woods Hole, MA 02543
    USA

    508-548-8700 x2271 (voice)
    508-457-2310 (FAX)
    dfoster@usgs.gov

    Date: 2008 (process 3 of 6)
    The bedrock surface was interpreted and digitized in Geographix Discovery SeisVision. The isochron between the bedrock surface and the riverbed were calculated and exported from Geographix Discovery SeisVision as a comma-delimited text file with easting (x), northing (y), and time (ms).

    Person who carried out this activity:

    David S. Foster
    U.S. Geological Survey
    Geologist
    384 Woods Hole Road
    Woods Hole, MA 02543
    USA

    508-548-8700 x2271 (voice)
    508-457-2310 (FAX)
    dfoster@usgs.gov

    Date: 2008 (process 4 of 6)
    Isochron points were imported into Dynamic Graphics, Inc. EarthVision surface modeling software. The data points were gridded at a 20 x 20-m cell size. The isochron grid was then converted to thickness in meters using a constant sediment velocity of 1,650 m/s. A 5-m bathymetric (referenced to IGLD 85) grid derived from our swath bathymetric data was added to the total sediment isopach grid to yield elevation (IGLD 85) grid of the bedrock surface. Elevation of the bedrock surface was exported as X (easting), Y (northing), and Z (meters) points.

    Dynamic Graphics, Inc. EarthVision version 7

    Person who carried out this activity:

    David S. Foster
    U.S. Geological Survey
    Geologist
    384 Woods Hole Road
    Woods Hole, MA 02543
    USA

    508-548-8700 x 2271 (voice)
    508-457-2310 (FAX)
    dfoster@usgs.gov

    Date: 2008 (process 5 of 6)
    The X, Y, and Z point data were converted to ESRI grid format using an AML script: xyz2grid.aml.

    ArcGIS 9.2

    Person who carried out this activity:

    David S. Foster
    U.S. Geological Survey
    Geologist
    384 Woods Hole Road
    Woods Hole, MA 02543
    USA

    508-548-8700 x2271 (voice)
    508-457-2310 (FAX)
    dfoster@usgs.gov

    Date: 2010 (process 6 of 6)
    The ESRI Grids were exported in ASCII format using Arc ToolBox - Converstion Tools - From Raster to ASCII.

    ArcGIS 9.2

    Person who carried out this activity:

    Jane F. Denny
    U.S. Geological Survey
    Geologist
    384 Woods Hole Road
    Woods Hole, MA 02543
    USA

    508-548-8700 x 2311 (voice)
    508-457-2310 (FAX)
    jdenny@usgs.gov

  3. What similar or related data should the user be aware of?

    Foster, David S. , and Denny, Jane F. , 2009, Quaternary Geologic Framework of the St. Clair River between Michigan and Ontario, Canada: Open-File Report 2009-1137, U.S. Geological Survey, Coastal and Marine Geology Program, Woods Hole Coastal and Marine Science Center, Woods Hole, MA.

    Online Links:

    Stockwell, John, 2007, Seismic Un*x: Center for Wave Phenomena - Colorado School of Mines, Golden, CO.

    Online Links:

    Barry, K.M., Cavers, D.A., and Kneale, C.W., 1975, Report on recommended standards for digital tape formats: Geophysics v. 40, no. 02, p. 344-352., Society of Exploration Geophysicists (SEG), Houston, TX.

    Online Links:


How reliable are the data; what problems remain in the data set?

  1. How well have the observations been checked?

  2. How accurate are the geographic locations?

    Differential Global Positioning System (DGPS) navigation data were acquired with a Communications Systems International (CSI), Inc. LGBX Pro receiver and sent to Boomer acquisition software, SonarWiz, where sub-bottom data were recorded in Society of Exploration Geophysicists Y (SEG-Y) format (Barry and others, 1975) with DGPS positions logged to the SEG-Y trace headers.

    DGPS accuracy is 1 to 3 meters (<http://www.navcen.uscg.gov/>). Error in horizontal position is introduced due to uncertainty in the measurement of layback of the seismic source. Overall horizontal accuracy is assumed to be on the order of 5 meters.

  3. How accurate are the heights or depths?

    The nominal resolution of the Boomer system is 1 meter. The vertical resolution of the bathymetric grid used in generating bedrock elevation is 0.5 m (referenced to IGLD 85). Overall vertical accuracy is assumed to be +/- 1 meter.

  4. Where are the gaps in the data? What is missing?

    All Boomer seismic data were used to generate this grid.

  5. How consistent are the relationships among the observations, including topology?

    The Boomer unique shot-point navigation and the Boomer SEG-Y data were evaluated during processing to eliminate spurious navigation and to assess the quality of the sub-bottom profiles.


How can someone get a copy of the data set?

Are there legal restrictions on access or use of the data?

Access_Constraints: None
Use_Constraints:
Public domain data from the U.S. Government are freely redistributable with proper metadata and source attribution. Please recognize the U.S. Geological Survey as the originator of the dataset.

  1. Who distributes the data set? (Distributor 1 of 1)

    Jane F. Denny
    U.S. Geological Survey
    Geologist
    384 Woods Hole Road
    Woods Hole, MA 02543
    USA

    508-548-8700 x2311 (voice)
    508-457-2310 (FAX)
    jdenny@usgs.gov

  2. What's the catalog number I need to order this data set?

    Downloadable Data

  3. What legal disclaimers am I supposed to read?

    Neither the U.S. Government, the Department of the Interior, nor the USGS, nor any of their employees, contractors, or subcontractors, make any warranty, express or implied, nor assume any legal liability or responsibility for the accuracy, completeness, or usefulness of any information, apparatus, product, or process disclosed, nor represent that its use would not infringe on privately owned rights. The act of distribution shall not constitute any such warranty, and no responsibility is assumed by the USGS in the use of these data or related materials.

    Any use of trade, product, or firm names is for descriptive purposes only and does not imply endorsement by the U.S. Government.

  4. How can I download or order the data?

  5. What hardware or software do I need in order to use the data set?

    The grid contained in the dsuelev.zip file is available as an ESRI Binary grid and an ASCII grid with an ESRI header. However, the folder structure within dsuelev.zip is critical to proper use of the ESRI binary grid.

    To utilize these data, the user must have a GIS software package capable of reading ESRI Binary grids or ASCII grids with ESRI headers, or be able to manipulate an ASCII matrix with a geospatial header. The ASCII raster files can be easily converted to ESRI grid format in either ArcView with Spatial Analyst extension (Import Data Source: ASCII Raster) or ArcGIS with Spatial Analyst extension (ASCII to Raster). The user should select floating point grid (as opposed to integer grid) when converting the data.


Who wrote the metadata?

Dates:
Last modified: 25-Jan-2011
Metadata author:
U.S. Geological Survey
c/o Jane F. Denny
Geologist
384 Woods Hole Road
Woods Hole, MA 02543
USA

508-548-8700 x2311 (voice)
508-457-2310 (FAX)
jdenny@usgs.gov

Metadata standard:
FGDC Content Standards for Digital Geospatial Metadata (FGDC-STD-001-1998)
Metadata extensions used:


Generated by mp version 2.8.25 on Tue Jan 25 16:55:31 2011