U.S. Geological Survey Open-File Report 2011–1003
Combined Multibeam and LIDAR Bathymetry Data from Eastern Long Island Sound and Westernmost Block Island Sound – A Regional Perspective
 |
||
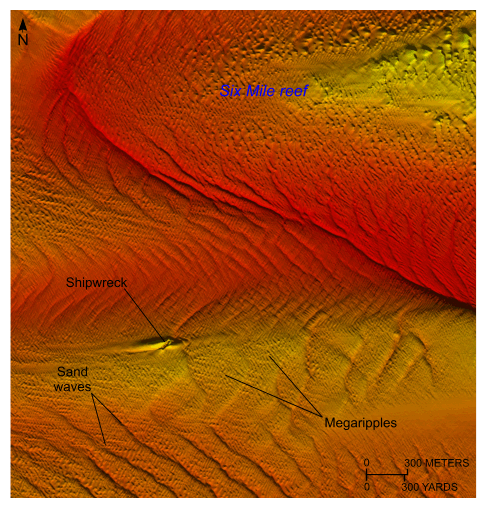
Figure 18. Detailed planar view of transverse sand waves around the western end of Six Mile Reef from the 4-meter digital terrain model (DTM) released in this report. Bathymetric data from this part of the DTM were originally collected during National Oceanic and Atmospheric Administration survey H11361. Note that asymmetry of the sand waves and scour around the wreck of the 80-meter Lake Hemlock, a converted WW1 cargo ship, indicate net westward sediment transport. Location of view is shown in figure 12. | ||


