U.S. Geological Survey Open-File Report 2011–1003
Combined Multibeam and LIDAR Bathymetry Data from Eastern Long Island Sound and Westernmost Block Island Sound – A Regional Perspective
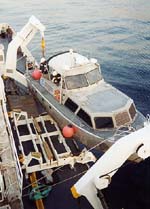
Multibeam BathymetryThe 63-meter (m) NOAA Ship Thomas Jefferson, and two 8.50-m aluminum Jensen launches deployed from the ship, were used to acquire the multibeam echosounder (MBES) bathymetric data between October 2003 and May 2009 (figs. 1, 2, 3, 4). The ship was primarily used to survey deeper waters (>20 m); the launches were primarily used to survey shallower waters (<20 m). The ship's MBES data were acquired with hull-mounted Simrad EM1002 and RESON 7125 systems (fig. 5). The launch MBES data were collected with hull-mounted RESON SeaBat 240-kilohertz (kHz) 8101 and 455-kHz 8125 shallow-water systems (figs. 6, 7). Original horizontal resolution of the MBES data collected aboard the ship was about 2 m; original horizontal resolution of the MBES data collected aboard the launches was about 0.5 m. However, combined BASE (bathymetry adjusted for statistical error) surfaces were typically generated at 2 m for most surveys. Exceptions include the 3-m BASE surface for survey H11442 and 4-m surface for survey H11441. Continuous MBES coverage was achieved for most surveys, but time, water depth, and equipment limitations resulted in significant data gaps within four of the surveys, including H11441, H11442, H11999, and H12013. Vertical resolution of the MBES data is about 0.5 percent of the water depth. The bathymetric data were acquired in XTF (extended Triton data format) and processed by NOAA using CARIS HIPS (Hydrographic Image Processing System) software for quality control, to incorporate sound velocity and tidal corrections, and to produce each continuous DTM. Navigation was by TSS POS/MV 320 differential GPS-assisted inertial navigation systems; the differential GPS beacons used were from Moriches, New York, Sandy Hook, New Jersey, and Acushnet, Massachusetts. HYPACK MAX was used for acquisition line navigation. Sound-velocity corrections were derived using frequent SEACAT CTD (conductivity-temperature-depth) profiles (figs. 8, 9). Typically, a CTD cast was conducted for every 2 to 4 hours of MBES acquisition. Tidal-zone corrections were calculated from data acquired from National Water Level Observation stations at New London and New Haven, Conn., and Montauk, N.Y. Vertical datum is mean lower low water. Detailed descriptions of the MBES acquisition and processing can be found in the descriptive reports available through the Data Catalog section of this report (National Oceanic and Atmospheric Administration, 2003, 2004a, 2004b, 2005a, 2005b, 2008a, 2008b, 2008c, 2008d, 2008e, 2009a, 2009b). Hydrographic LIDAR DataEleven reconnaissance cruises were conducted aboard a leased lobster boat to monitor water clarity prior to commencement of airborne survey operations. These cruises, which utilized Secchi disks to determine water clarity, were conducted between the Connecticut River and Fishers Island from May 9, 2003, to January 11, 2004, when water clarity was deemed adequate. The LIDAR data were acquired by Tenix LADS, Inc., from January 25 to March 3, 2004, with a LADS Mk II system. Airborne survey operations were conducted aboard a Dash 8-202 series aircraft (fig. 10) with a Nd:YAG laser at heights between 365 and 670 feet, at ground speeds between 140 and 210 knots, and variably at 4x4-m (primarily for survey H11224) and 3x3-m (primarily for survey H11225) laser-spot spacings. Green laser pulses were scanned beneath the aircraft in a rectilinear pattern. The returned green-laser energy reflected from the sea surface and sea floor were captured and digitally recorded. Received infrared laser energy, supplemented by an Altitude Heading Reference System (AHRS) inertial height reference and kinematic GPS, was used to determine the height of the aircraft. Real-time positioning was provided by wide area differential global positioning system (WADGPS). Acquired data were processed with Tenix's Ground System, which uses proprietary software. Detailed descriptions of the LIDAR acquisition and processing can be found in the descriptive reports (National Oceanic and Atmospheric Administration, 2004c; 2004d). Data ProcessingThe average-depth CARIS BASE surfaces (field sheets) from all surveys were read back into CARIS HIPS software and inspected to check dataset integrity and to determine whether unacceptable vertical and (or) horizontal offsets were present where the surveys overlapped. The Base Surface -> Combine command within CARIS HIPS was then used to combine all of the source CARIS BASE surfaces into a master BASE surface having a 4-meter grid resolution. This combined BASE surface was exported from CARIS as a Bathymetric Attributed Grid (BAG) file. The BAG surface was imported into Fledermaus to make equivalent DTM files using DMagic. The floating point format for each sounding depth point was preserved during data import; the BAG surface was imported into Fledermaus as "gridded data", therefore re-gridding of data did not occur during the import process and thus preserved the original resolution of the CARIS BASE surface. The DTM was then exported as an ESRI ASCII raster file. This ASCII raster file was then imported into ArcMap and converted into raster with ArcToolbox using the ASCII to Raster conversion tool to create the UTM Zone 18N, NAD 83 grid (eliscomb_utm). This grid was then reprojected using the ArcToolbox data management tool Project Raster to create the geographic, WGS84 coordinate system grid (eliscomb_geo); resolution is 0.1544 arc seconds. The resampling technique during reprojection was bilinear; transformation 5 was selected. A color, hill-shaded GeoTIFF image of the 14 combined datasets in UTM Zone 18N, NAD 83 was exported directly from CARIS HIPS. Subsequently, this image was imported into ArcMap and reprojected into the geographic, WGS84 coordinate system using the Project Raster data management tool. As with the grids, the resampling technique was bilinear; transformation 5 was selected. Color ramps for both GeoTIFFs have the same range, with sun illumination from the north at 45 degrees above the horizon and a vertical exaggeration of 5x. The world registration files were created from the GeoTIFF images with GeoTIFF Examiner software. More detailed descriptions of the processing steps performed by the USGS to create the datasets presented in this report are included in the metadata files. These files can be accessed through the Data Catalog section of this report. |