Open-File Report 2011-1246
Moderate-Resolution Sea Surface Temperature Data and Seasonal Pattern Analysis for the Arctic Ocean Ecoregions
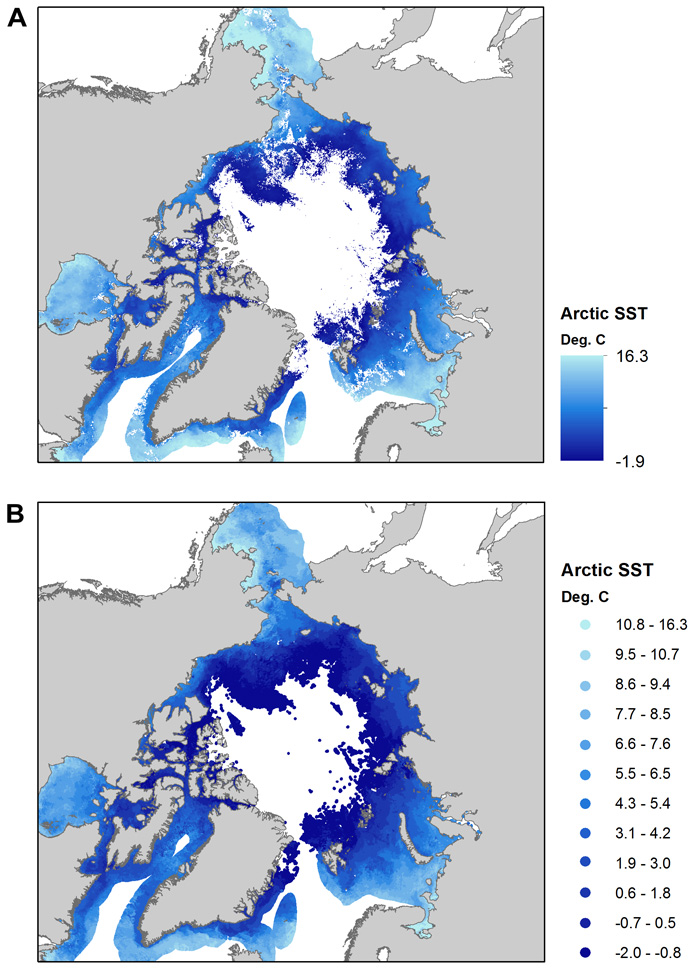 |
Figure 2. Map of monthly average SSTs in the Arctic Ocean ecoregions for September 2009. Figure 2A is raster format data, figure 2B is point shapefile format data. The absence of data at the pole approximately corresponds to the sea ice coverage for September 2009 (Fetterer and others, 2002, updated 2009).
|

![]() U.S. Department of the Interior |
U.S. Geological Survey
U.S. Department of the Interior |
U.S. Geological Survey
URL: http://pubsdata.usgs.gov/pubs/of/2011/1246/figure2.html
Page Contact Information: GS Pubs Web Contact
Page Last Modified: Thursday, 08-Dec-2016 00:16:55 EST
