USGS - science for a changing world
U.S. Environmental Protection Agency

Open-File Report 2011-1246

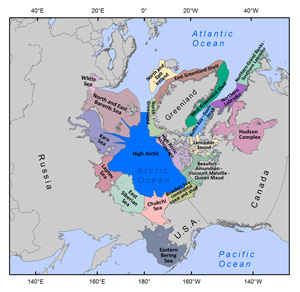
Moderate-Resolution Sea Surface Temperature Data and Seasonal Pattern Analysis for the Arctic Ocean Ecoregions


List of Figures

Thumbail image for Figure 1, map of Arctic realm, and link to full-sized figure. Figure 1. Map of Arctic realm as defined by the Marine Ecoregions of the World (MEOW; Spalding and others, 2007).
Thumbail image for Figure 2, maps of montly average sea surface temperature based on data in different formats, and link to full-sized figure. Figure 2. Map of monthly average SSTs in the Arctic Ocean ecoregions for September 2009. Figure 2A is raster format data, figure 2B is point shapefile format data. The absence of data at the pole approximately corresponds to the sea ice coverage for September 2009 (Fetterer and others, 2002, updated 2009).
Thumbail image for Figure 3A, diagram of plot parts for Figure 3B, and link to full-sized figure. Figure 3A. Legend diagram for figure 3B.
Thumbail image for Figure 3B, plots of mean monthly sea surface temperatures for 20 realms in the Arctic Ocean ecoregion, and link to full-sized figure. Figure 3B. Arctic Ocean ecoregion plots of annual cycles of mean monthly SSTs.
Thumbail image for Figure 4, dendrogram of Arctic ecorgions, and link to full-sized figure. Figure 4. Euclidean distance cluster diagram for Arctic Ocean ecoregions based on 29-year mean, minimum, maximum, annual range and annual variance of SST. The red boxes denote clusters where p > 0.95.

Accessibility FOIA Privacy Policies and Notices

Take Pride in America logo USA.gov logo U.S. Department of the Interior | U.S. Geological Survey
URL: http://pubsdata.usgs.gov/pubs/of/2011/1246/figures.html
Page Contact Information: GS Pubs Web Contact
Page Last Modified: Thursday, 08-Dec-2016 00:16:34 EST