Open-File Report 2011-1246
Moderate-Resolution Sea Surface Temperature Data and Seasonal Pattern Analysis for the Arctic Ocean Ecoregions
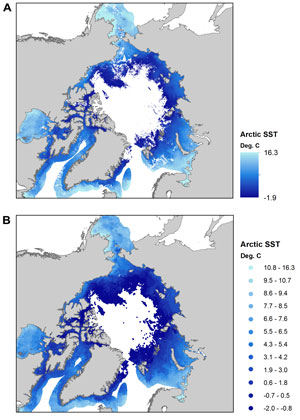
AVHRR SST DataThe Advanced Very High Resolution Radiometer (AVHRR) is a multi-generational, 6-channel instrument that has been flown on board a series of NOAA polar-orbiting satellites, and has been returning reliable SST data since 1981. Sea surface temperature is not measured directly; rather, it is derived from a differentiation of brightness temperatures recorded by two of the sensor's infrared (IR) channels (channels 4 and 5). Furthermore, the Pathfinder algorithm used to calculate SST accounts for the non-linear relationship between surface and brightness temperatures that arises from variable atmospheric water vapor content, and also uses matchup data from in situ buoys aggregated within 5-month weighted windows, reducing bias due to temporal trends (Kilpatrick and others, 2001). The PFSST (and later) datasets were developed jointly by the University of Miami Rosenstiel School of Marine and Atmospheric Science and the NOAA National Oceanographic Data Center (NODC) as a more accurate, downscaled (9.28–4 km) version of a previous global AVHRR dataset (Vazquez-Cuervo and others, 1998). Importantly for the study of the Arctic, the version 5 (and later) PFSST data also were improved through the implementation of an ice mask. We obtained the version 5 (PFSST monthly mean floating point data from the NASA JPL Physical Oceanography Distributed Active Archive Center (PO.DAAC) (ftp://podaac.jpl.nasa.gov/OceanTemperature/avhrr/L3/pathfinder_v5/). PFSST products (version 5.0 and 5.1) also are available through the NODC (ftp://data.nodc.noaa.gov/pub/data.nodc/pathfinder). For a detailed description of the AVHRR and Pathfinder algorithms, we direct the reader to Vazquez-Cuervo and others (1998; 2010) and Kilpatrick and others (2001). AVHRR Data QualityThe PFSST data include a quality flag product in which each SST pixel is designated a value ranging from 0 (worst quality) to 7 (best quality). These quality flags convey the level of confidence attributed to the SST value calculated for each pixel location. The level of confidence is evaluated on pixel-by-pixel performance with respect to a number of tests that estimate validity and consistency of brightness temperature readings, sun angle effects, and cloudiness, which are combined to establish an overall quality rating. The version 4 Pathfinder release of the SST dataset (PFSST V41) included a standard product called "best SST," or "BSST." BSST data includes pixels with quality flags greater than 3 (Kilpatrick and others, 2001). We generated an analogous SST product from the PFSST data by disregarding SST values with corresponding quality flag values of less than 4. Despite the rigors of the flagging algorithms, a small number of pixels with illegitimate jumps in SST gradient have been detected (Evans and others, 2009). The Arctic data presented here may potentially contain a few of these artifacts that may need to be removed by the user depending on their data requirements. Most occurrences can be eliminated by adopting a more rigorous quality standard (for example, only using data with corresponding quality flags of 7). However, this also serves to substantially reduce the amount of data available for analysis, a problem compounded by climatic conditions in the Arctic. In addition to performing the analyses discussed here with the BSST data, we repeated the analyses using data with quality flag values of 7 only. In table 1, we show the summary R-squared statistics comparing the BSST data to Q7 data using the ecoregional aggregation of monthly mean SSTs over 29 years. The only ecoregion having significantly divergent values when using the BSST product versus the Quality 7 product is the High Arctic (essentially the Arctic Ocean). This result is to be expected, however, due to the Arctic Ocean ice cover throughout much of the year. Although both BSST and Quality 7 data have ice masks to account for this, data on the periphery of the ice mask do not typically have quality flag of 7, thereby reducing the number of Quality 7 data as compared to BSST data. Data AccuracyCurrently (2011), the only reports on accuracy of Pathfinder SST values are linked to specific studies across a variety of spatial and temporal resolutions, pathfinder versions, and quality flag thresholds. In general, the temperature values are reported to have RMS errors between 0.1 and 1.0 °C (Kearns and others, 2000; Kilpatrick and others, 2001; Vazquez-Cuervo and others, 2010; Xu and Ignatov, 2010) when compared to in situ temperatures. However, it must be cautioned that in situ temperature data derived from multiple sources, such as moored buoys and shipboard observations, are prone to large random errors and rarely have excellent agreement amongst them (for example, Kearns and others, 2000). Furthermore, in situ measurements are of bulk temperatures (typically taken between 1 and 3 m depth) rather than true sea surface temperature. Lastly, comparison to in situ data sources, such as buoys and the National Centers for Environmental Prediction (NCEP), are not independent of PFSST data because these data (Reynolds and others, 2002) provide critical calibration and validation for the PFSST data product (Kilpatrick and others, 2001; Vazquez-Cuervo and others, 2010). When the scaling algorithm provided with the AVHRR data is applied, the resulting SST values are rounded to the nearest 10th of degree as accuracy of the SST data is approximately 0.5 °C (Jorge Vazquez-Cuervo, written commun., February 3, 2011). Arctic SST ProductWe selected AVHRR data for their global coverage at moderate resolution (4 km), their long data record (about 30 years) relative to other satellite missions and their substantial level of processing, including extensive calibration and atmospheric correction. The data represent a time-series of monthly mean sea surface temperatures over the last 29 years. Here, we provide the monthly mean SST data in three forms: (1) georeferenced ".img" raster format, (2) georeferenced ESRI point shapefile (.shp) format, and (3) plain comma-delimited text format. There is one file of each type for each month of each year in the 1981–2009 record. They are downloadable through this OFR (https://pubs.usgs.gov/of/2011/1246/) in zipped files of yearly bundles containing the GIS layers as well as the related metadata files. In some places, the data appear jagged, or "moth-eaten," immediately
adjacent to the coast and at very high latitude. Satellite data for
some coastal regions are missing or are unusable due to low quality,
most often due to climatic conditions. Furthermore, the Pathfinder
data developers used a MOD12Q1 land mask, which has a 1-km resolution,
to define their coastline. Missing data in the vicinity of the North
Pole (as seen in fig. 2) is caused by several phenomena. First, the
near-polar orbits of the satellites housing the AVHRR instruments never
quite reach the pole. Second, sea ice plays a significant role throughout
most of the year. We examined the Sea Ice Index extent product generated
by the National Snow and Ice Data Center (NSIDC) (Fetterer and others,
2002, updated 2009) and found that the missing data surrounding the
North Pole (for example, see fig. 2) corresponds well with the sea
ice margin delineated by the NSIDC index. Third, in some instances,
pixels have been eliminated due to cloud cover and to the Pathfinder
SST algorithm resulting in pixels with values less than -2.0 °C
that must be eliminated due to infeasibility. For all datasets, SST
values are recorded in degrees Celsius.
|
|

![]() U.S. Department of the Interior |
U.S. Geological Survey
U.S. Department of the Interior |
U.S. Geological Survey
URL: http://pubsdata.usgs.gov/pubs/of/2011/1246/description.html
Page Contact Information: GS Pubs Web Contact
Page Last Modified: Thursday, 08-Dec-2016 00:16:52 EST