Open-File Report 2011-1246
Moderate-Resolution Sea Surface Temperature Data and Seasonal Pattern Analysis for the Arctic Ocean Ecoregions
| A. |
 |
| B. |
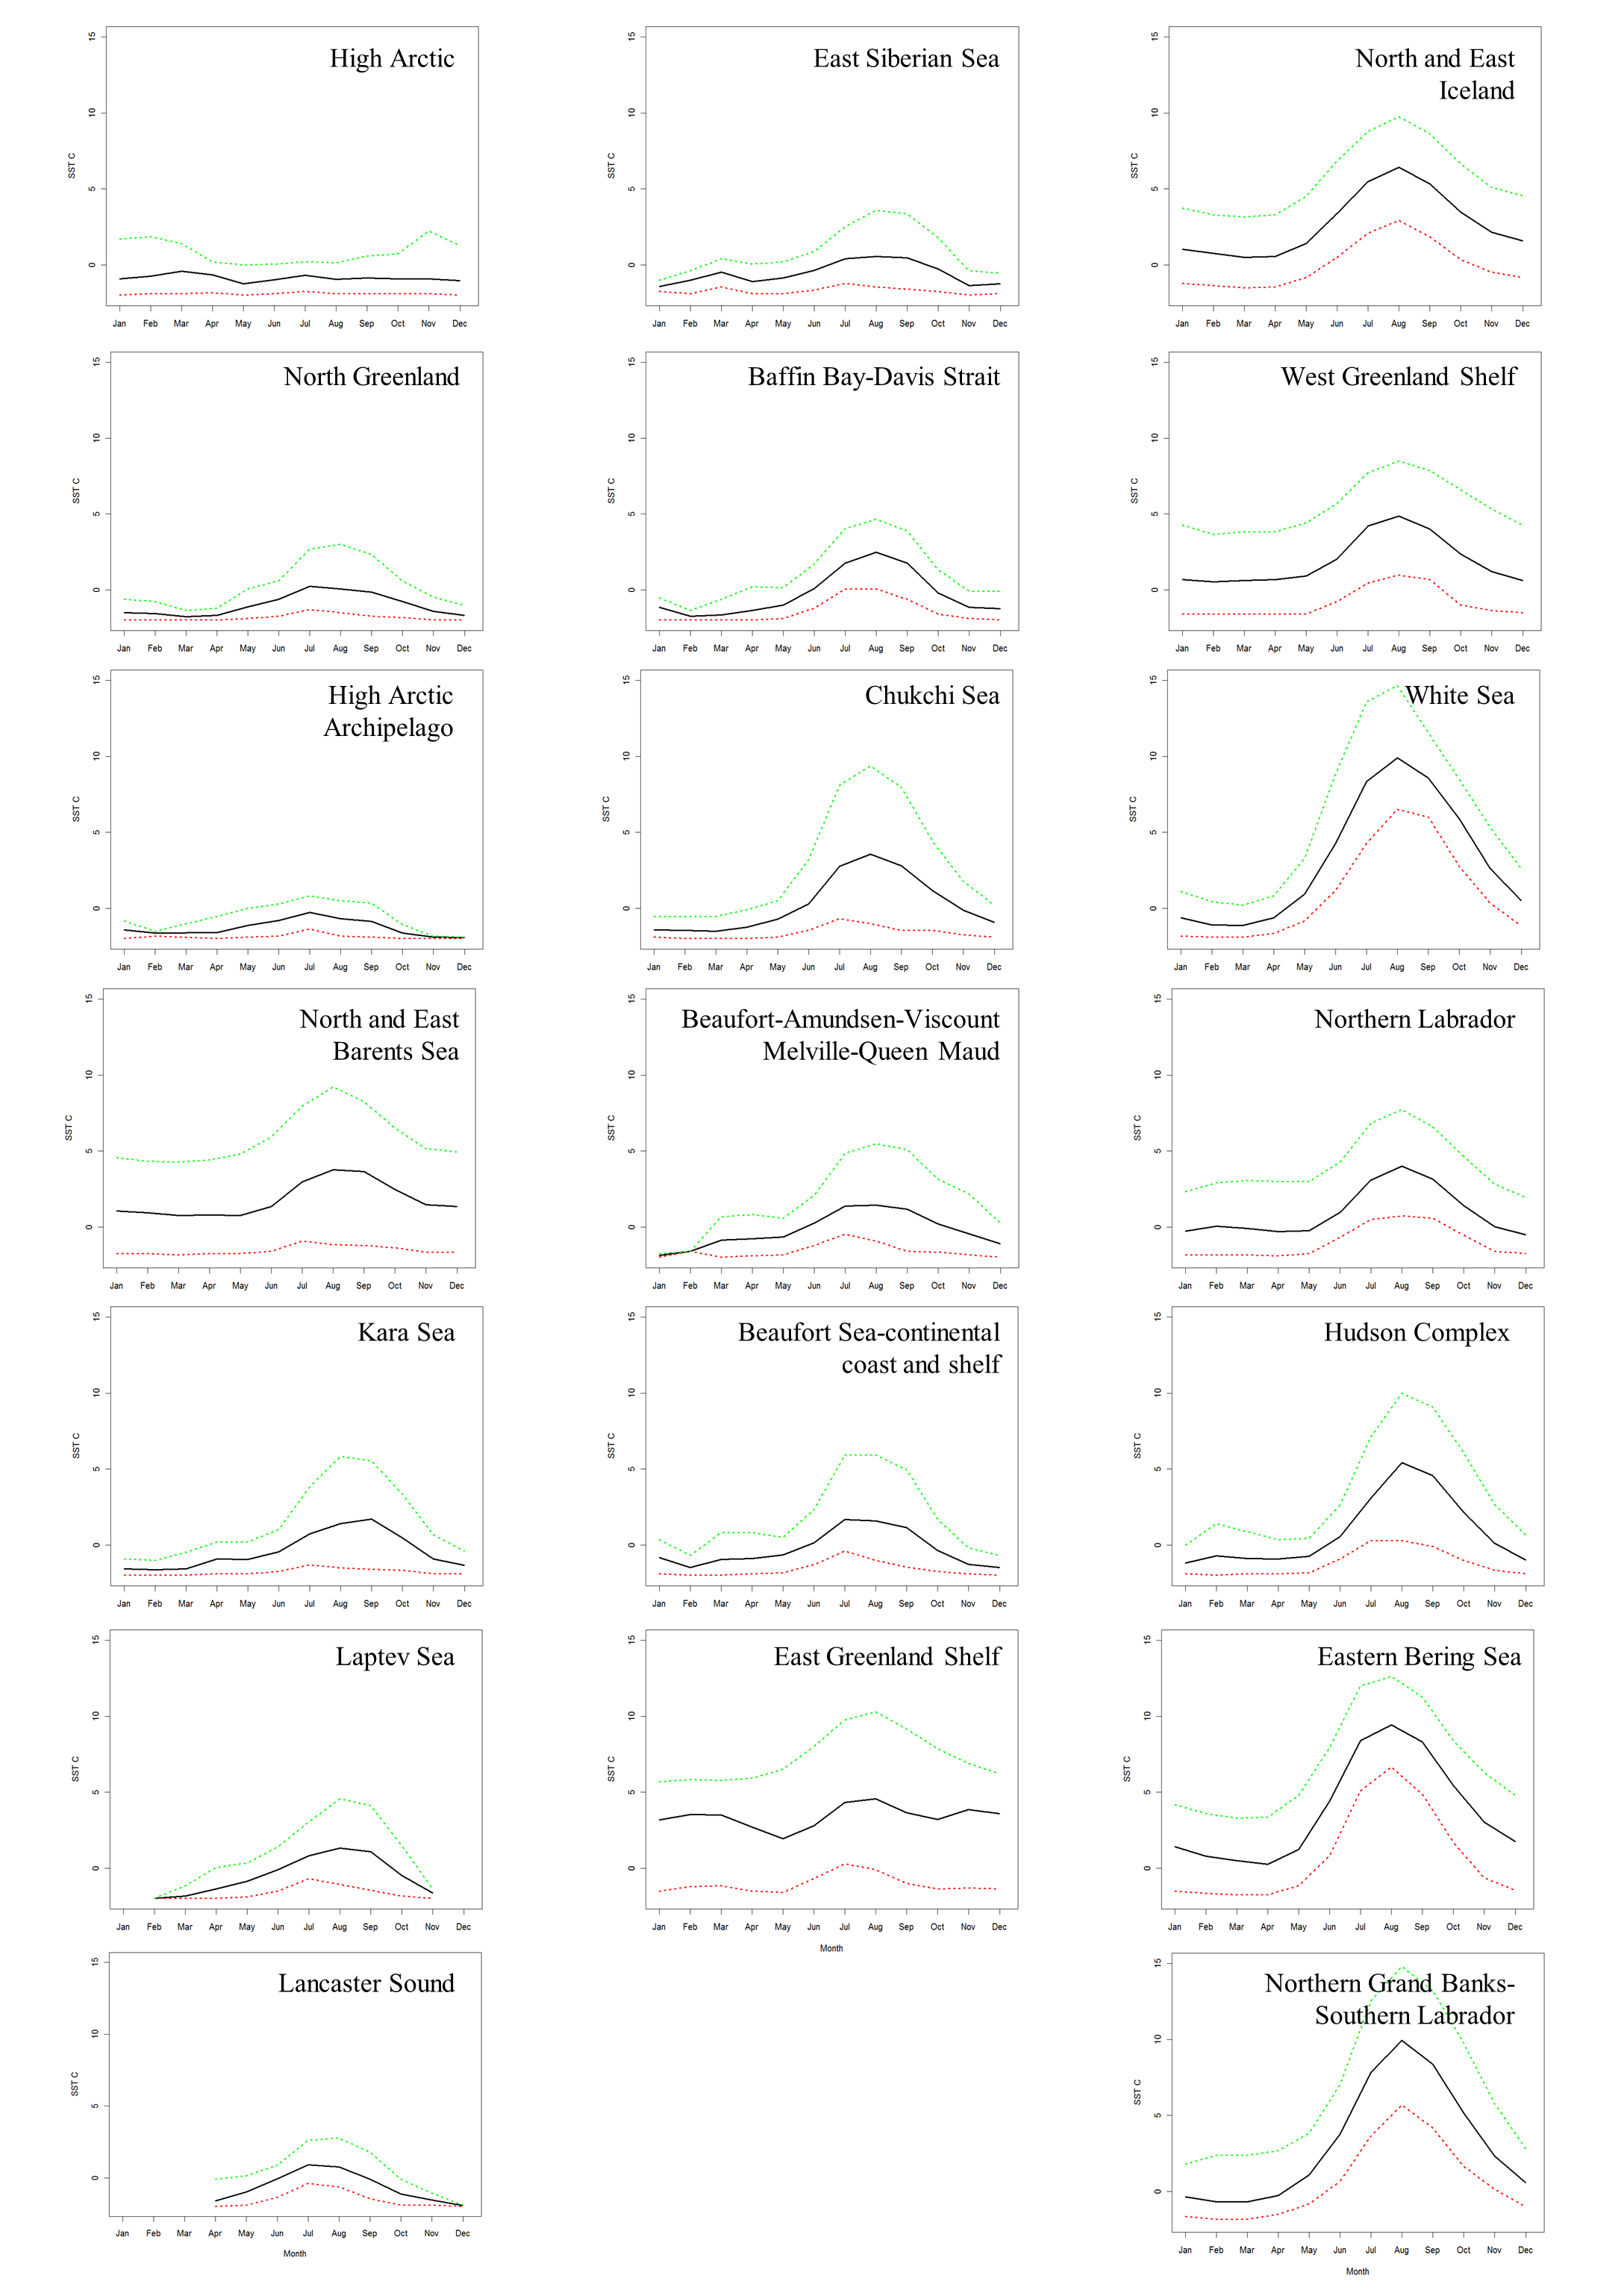 |
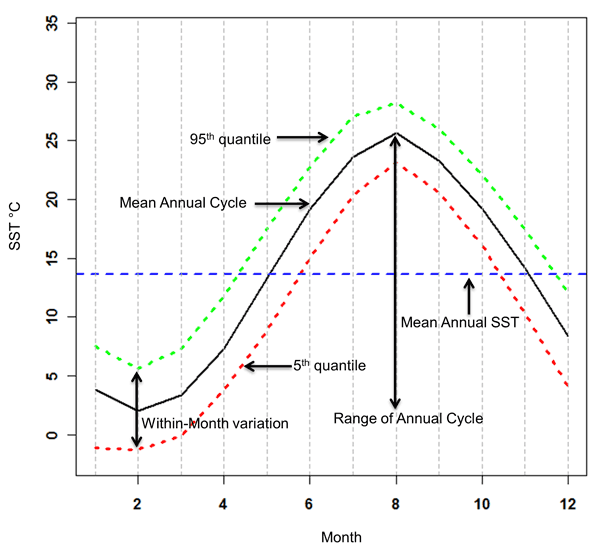
Figure 3. Figure 3A) Legend diagram for figure 3B. Figure 3B) Arctic Ocean ecoregion plots of annual cycles of mean monthly SSTs. View full-size image of figure 3B (432 KB).
|

![]() U.S. Department of the Interior |
U.S. Geological Survey
U.S. Department of the Interior |
U.S. Geological Survey
URL: http://pubsdata.usgs.gov/pubs/of/2011/1246/figure3.html
Page Contact Information: GS Pubs Web Contact
Page Last Modified: Thursday, 08-Dec-2016 00:16:56 EST
