Open-File Report 2011-1246
Moderate-Resolution Sea Surface Temperature Data and Seasonal Pattern Analysis for the Arctic Ocean Ecoregions
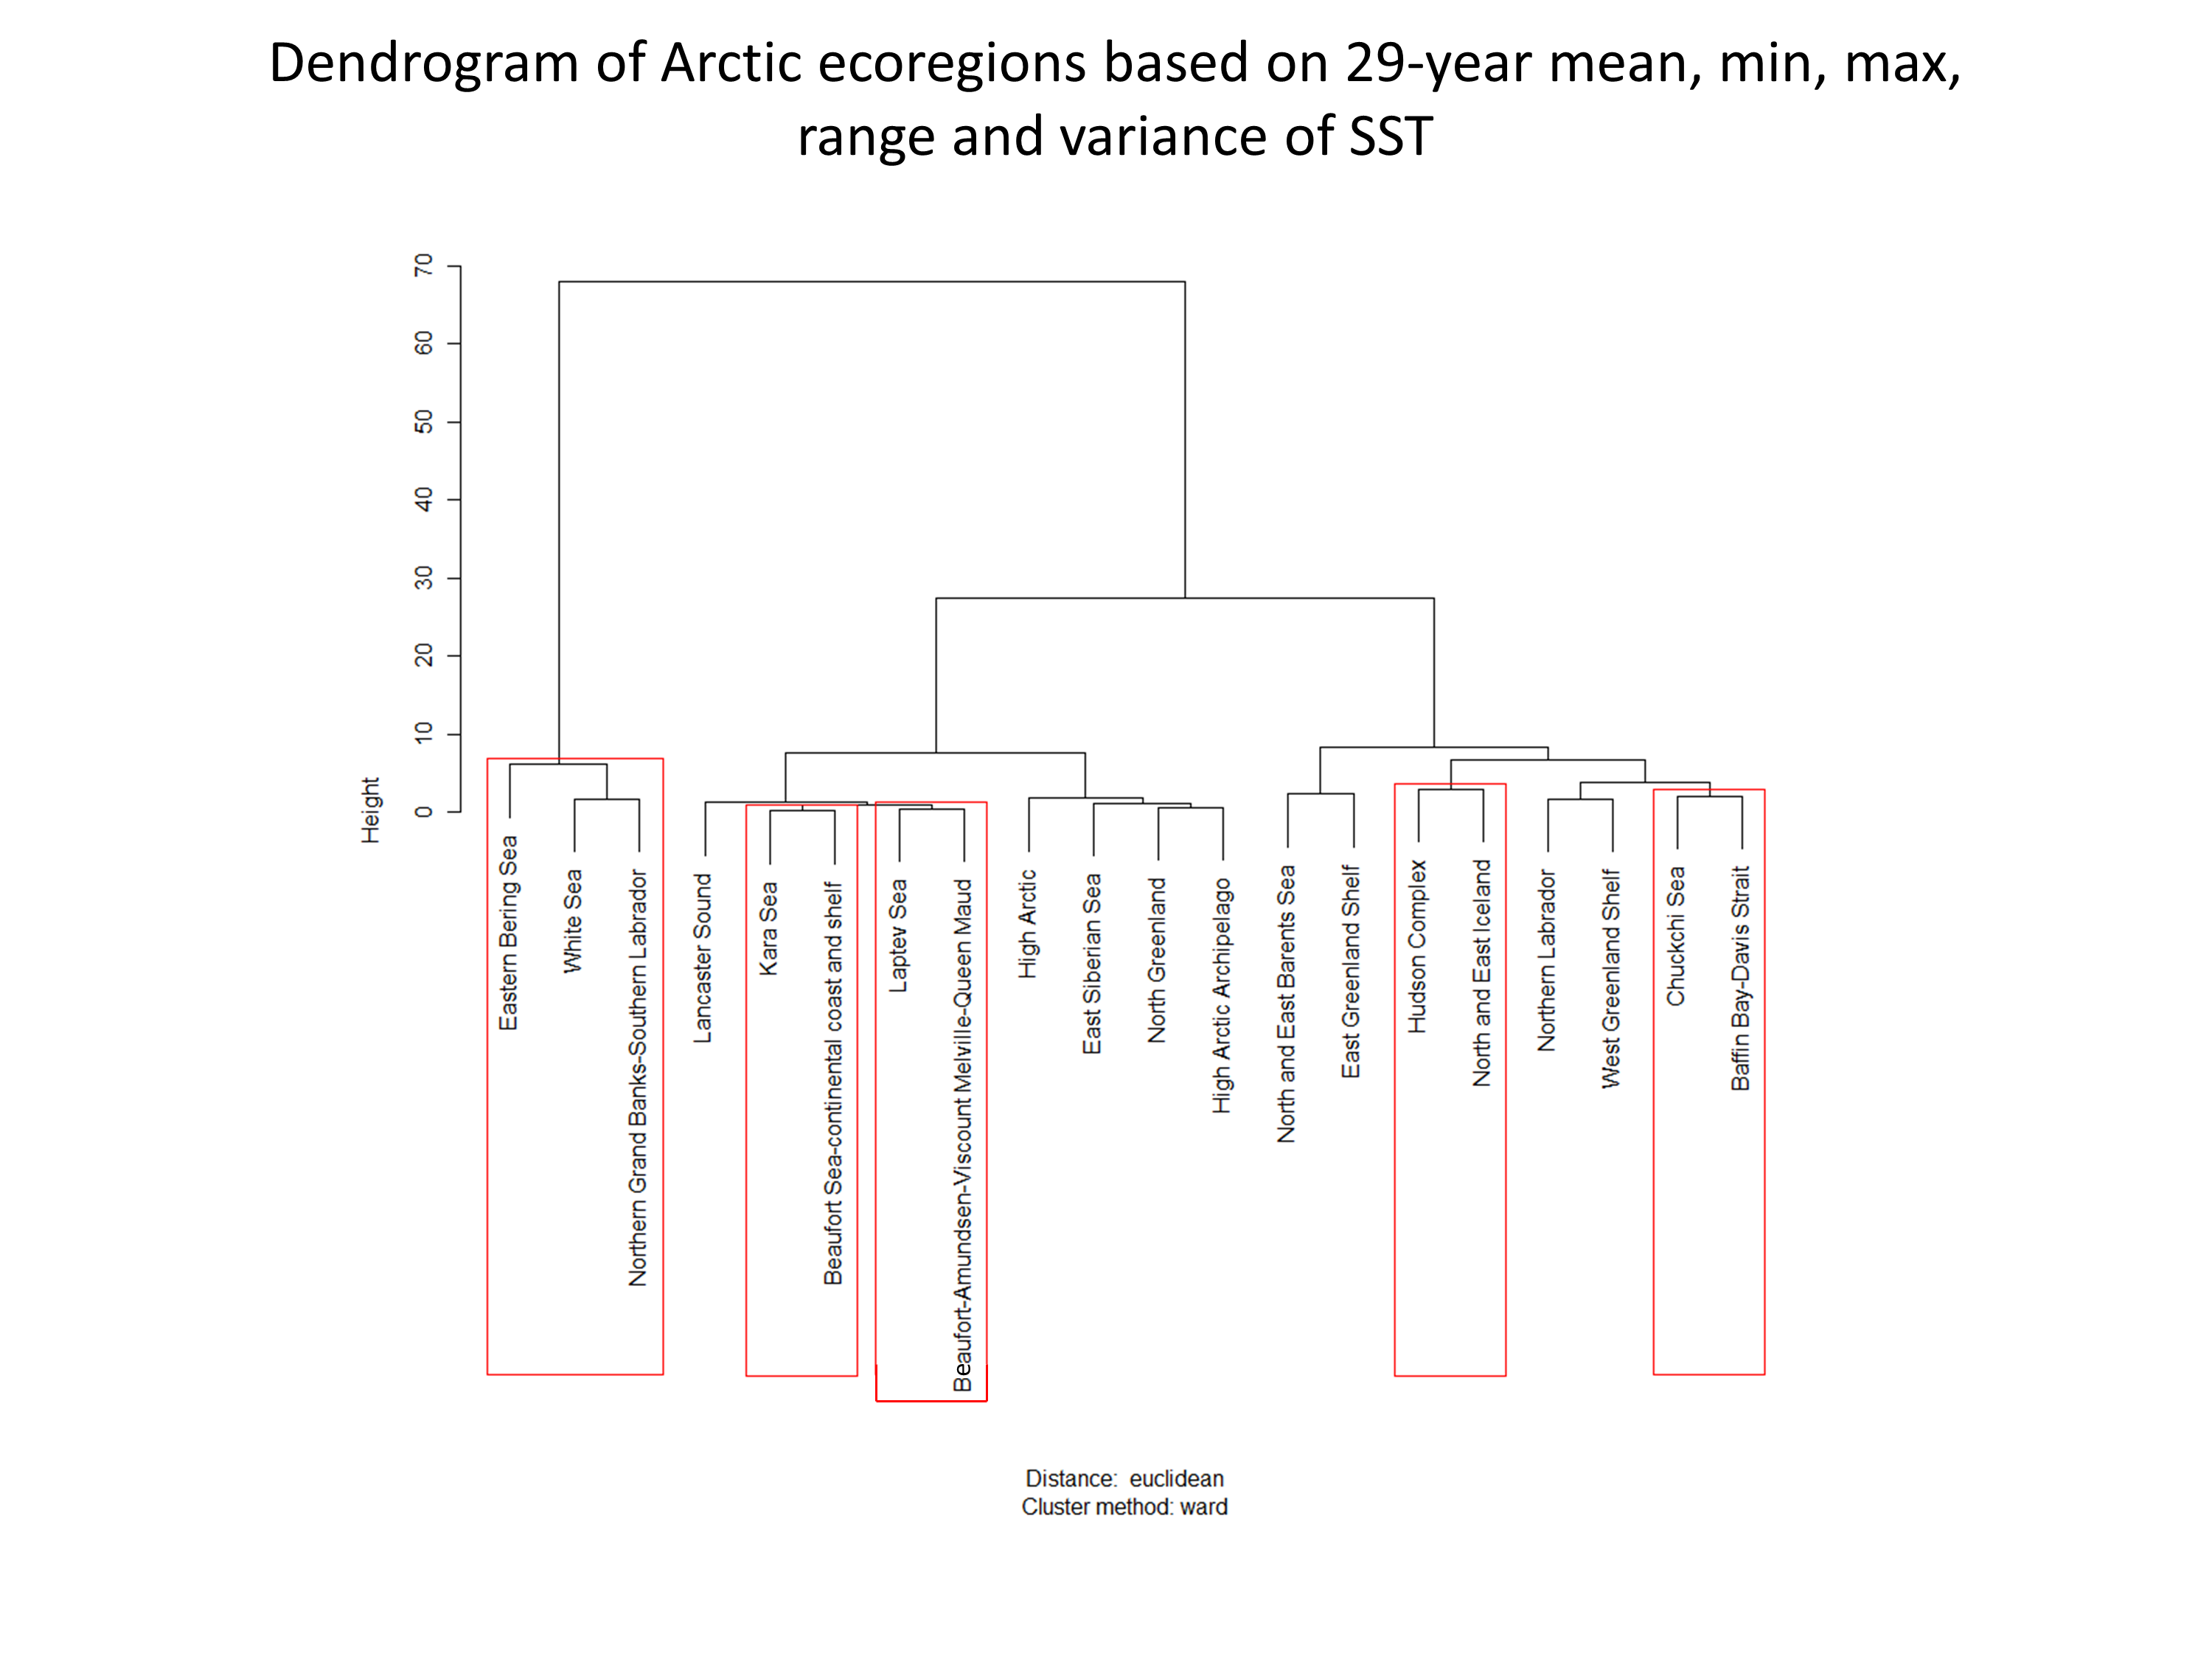 |
Figure 4. Euclidean distance cluster diagram for Arctic Ocean ecoregions based on 29-year mean, minimum, maximum, annual range and annual variance of SST. The red boxes denote clusters where p > 0.95. View full-size image (415 KB).
|

![]() U.S. Department of the Interior |
U.S. Geological Survey
U.S. Department of the Interior |
U.S. Geological Survey
URL: http://pubsdata.usgs.gov/pubs/of/2011/1246/figure4.html
Page Contact Information: GS Pubs Web Contact
Page Last Modified: Thursday, 08-Dec-2016 00:16:57 EST
