Skip past header information
USGS - science for a changing world
CZM logo with link to CZM home page

U.S. Geological Survey Open-File Report 2012-1183

Massachusetts Shoreline Change Project: A GIS Compilation of Vector Shorelines and Associated Shoreline Change Data for the 2013 update


Introduction

Skip past contents information
Click on figures for larger images.
Thumbail image for Figure 1 and link to full-sized figure 1. index map of massachusetts coast

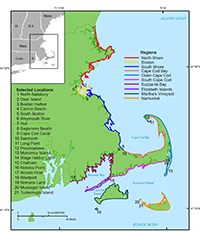
Figure 1. Index map of the Massachusetts coast showing the 10 geographic regions used to organize and publish the shoreline rate-of-change data in this report

The U.S. Geological Survey (USGS) in cooperation with the Massachusetts Office of Coastal Zone Management (CZM) has compiled a comprehensive database of digital vector shorelines and shoreline change rates for the Massachusetts coast as the 2013 update to the Massachusetts Shoreline Change Project. In 1989, the CZM launched the Shoreline Change Project in order to identify erosion-prone areas of the coast (Benoit, 1989). In 2001, a 1994 shoreline was added to calculate both long-term and short-term shoreline change rates along ocean-facing sections of the Massachusetts coast (Thieler and others, 2001). Shorelines and transects with rates of shoreline change from these studies are available in MORIS, the Massachusetts Ocean Resource Information System. This 2013 update includes a shoreline derived from color orthophotographs taken in 2001 along the coast from Hull to the Cape Cod Canal (Applied Coastal Research and Engineering, Inc., 2006), an oceanfront shoreline delineated from color orthophotographs taken in 2008 and 2009, and a 2007 lidar-derived shoreline along the ocean-facing coasts of outer Cape Cod. These new shorelines were added to existing historical data obtained from the previous Shoreline Change Project report published by the CZM (Thieler and others, 2001) and shoreline data from the USGS National Assessment of Shoreline Change Project (Himmelstoss and others, 2010). Because of the volume of data, the State was divided into 10 geographic regions for analysis (fig. 1). Long- and short-term rates were computed for the State using the latest version of the Digital Shoreline Analysis System (Thieler and others, 2009). Long-term rates were calculated based on all available data at a given location, and short-term rates were calculated for an approximate 30-year time span using the most recent data. This report includes a description of the methods used to compile the data and calculate the rate-of-change statistics, as well as a Geographic Information Data (GIS) data catalog of all shoreline data, measurement locations, and rates. The companion report to this data release includes an in-depth discussion and regionally averaged results for each geographic region (Thieler and others, 2013).

Accessibility FOIA Privacy Policies and Notices

Take Pride in America logo USA.gov logo U.S. Department of the Interior | U.S. Geological Survey
URL: http://pubsdata.usgs.gov/pubs/of/2012/1183/introduction.html
Page Contact Information: GS Pubs Web Contact
Page Last Modified: Thursday, 05-Sep-2013 09:14:25 EDT