List of Figures |
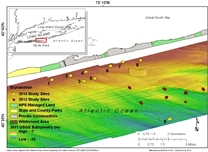 |
Figure 1. U.S. Geological Survey (USGS) 2012 and 2014 study sites off Fire Island, New York. Bathymetry is shown in meters (m). National Park Service (NPS) managed land, State and county parks, private communities, and Federal wilderness areas on the barrier islands are indicated on the map. |
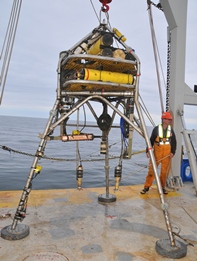 |
Figure 2. A high-resolution flow tripod (Flobee) holding instrumentation to measure flow and sediment resuspension. Photograph by Sandra Brosnahan, U.S. Geological Survey. |
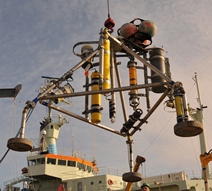 |
Figure 3. Minipods holding instrumentation to measure the seabed surface and current velocity profiles were deployed at sites 2 and 3. Photograph by Sandra Brosnahan, U.S. Geological Survey. |
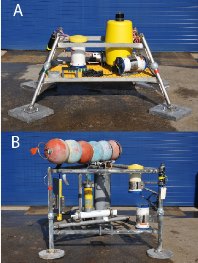 |
Figure 4. Deployment of A, a nanopod at site 6 and B, micropods at sites 1, 7, 8, and 9. Photographs by Dan Blackwood, U.S. Geological Survey. |
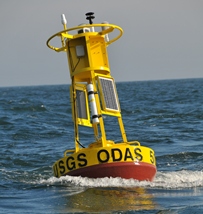 |
Figure 5. The buoys at sites 1, 4, and 8 were equipped with meteorological instrumentation. Photograph by Sandra Brosnahan, U.S. Geological Survey. |
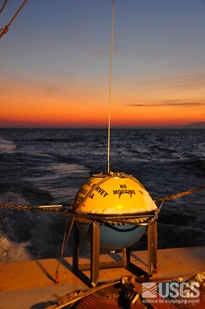 |
Figure 6. The Datawell Waverider buoy was deployed at site 9 to measure the incoming wave field. Photograph by Sandra Brosnahan, U.S. Geological Survey. |
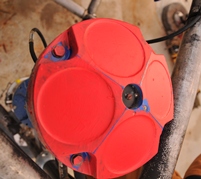 |
Figure 7. An acoustic Doppler current profiler. Sensors are covered in cayenne antifouling paste. Photograph by Sandra Brosnahan, U.S. Geological Survey. |
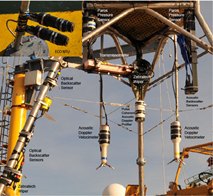 |
Figure 8. A view of the high-resolution flow tripod (Flobee) from below. Instruments labeled are acoustic Doppler velocimeters, a pulse-coherent acoustic Doppler profiler, optical backscatter sensors, acoustic backscatter sensors, Paroscientific Digiquartz (Paros) pressure sensors, a transmissometer, an Environmental Characterization Optics (ECO) turbidity meter, and Zebratech wipers. Photographs by Sandra Brosnahan, U.S. Geological Survey. |
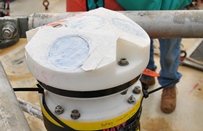 |
Figure 9. A Nortek acoustic wave and current profiler covered with antifouling zinc paste. Photograph by Sandra Brosnahan, U.S. Geological Survey. |
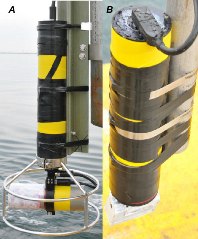 |
Figure 10. A, pencil beam and B, fan beam Imagenex sonar heads. Photographs by Sandra Brosnahan, U.S. Geological Survey. |
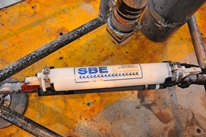 |
Figure 11. A Sea-Bird Electronics Seagauge mounted on a micropod. Photograph by Sandra Brosnahan, U.S. Geological Survey. |
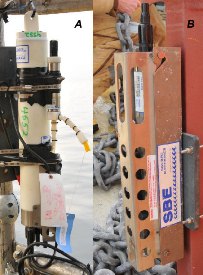 |
Figure 12. Sea-Bird Electronics A, Seacat and B, Microcat. Photographs by Sandra Brosnahan, U.S. Geological Survey. |
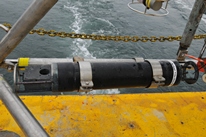 |
Figure 13. A laser in situ suspended scattering and transmissometry (LISST) instrument mounted on a minipod. Photograph by Sandra Brosnahan, U.S. Geological Survey. |
